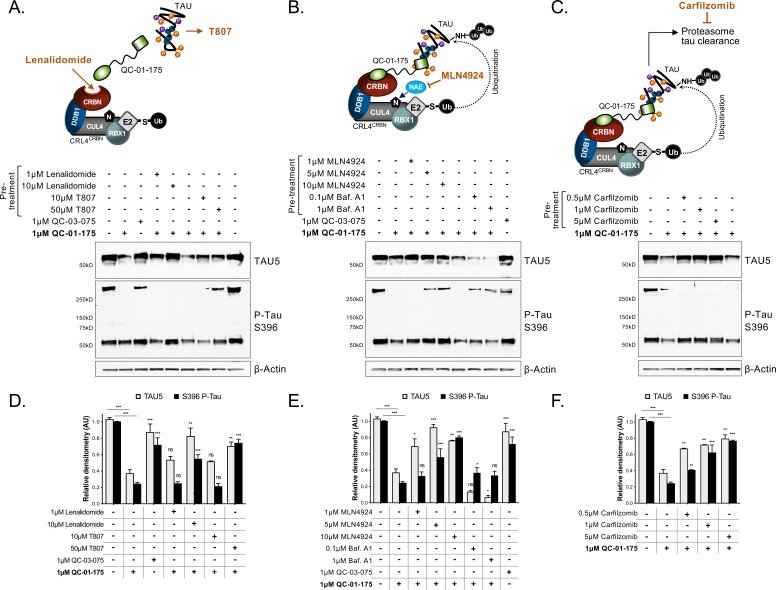
Figure 3. Mechanism of QC-01–175 clearance of tau is CRL4CRBN and UPS-dependent.
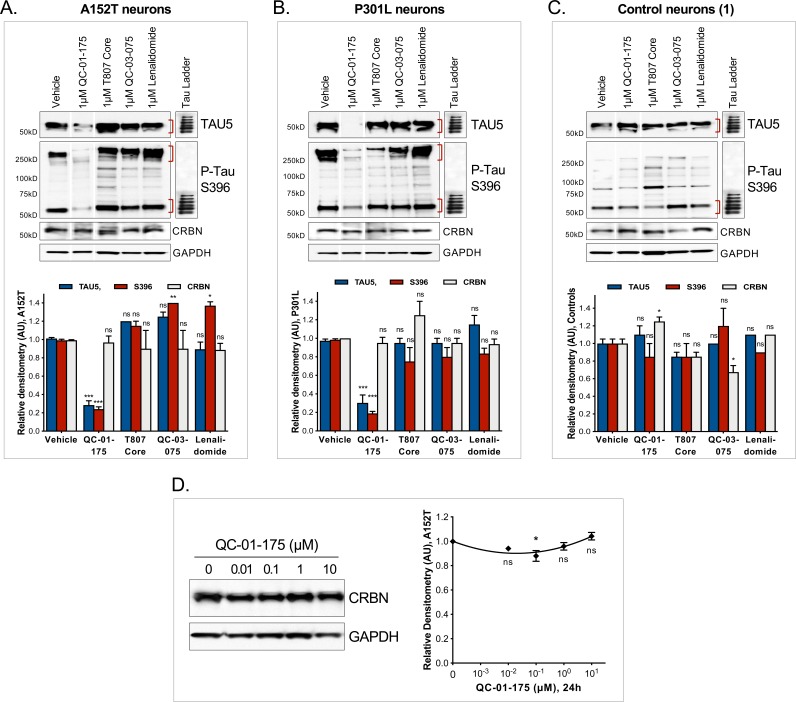
Neurons were pre-treated for 6 hr with (A) either CRBN ligand excess lenalidomide or tau ligand excess T807, (B) the NAE inhibitor MLN4924, the autophagy inhibitor Baf.A1, or (C) the proteasome inhibitor carfilzomib; followed by 18 hr treatment with QC-01–175 (or negative control QC-03–075), for a total of 24 hr. Total (TAU5) and P-tau S396 levels were analyzed by western blotting. (A–C) Representative blots are shown. (D–F) Densitometry bars represent tau mean intensity values ± SD (n = 3), relative to vehicle-treated samples. Student T-test of QC-01–175 samples relative to vehicle treated, and the remainder bars show p-value of each pre-treatment relative to QC-01–175 to assess rescue of clearance effect (***p<0.001, **p<0.01, *p<0.05, nsp>0.05). A152T neurons were differentiated for 6 weeks. Figure 3—figure supplement 1 includes additional specificity controls for A152T, P301L and control neuronal models. The following figure supplement is available for Figure 3.


