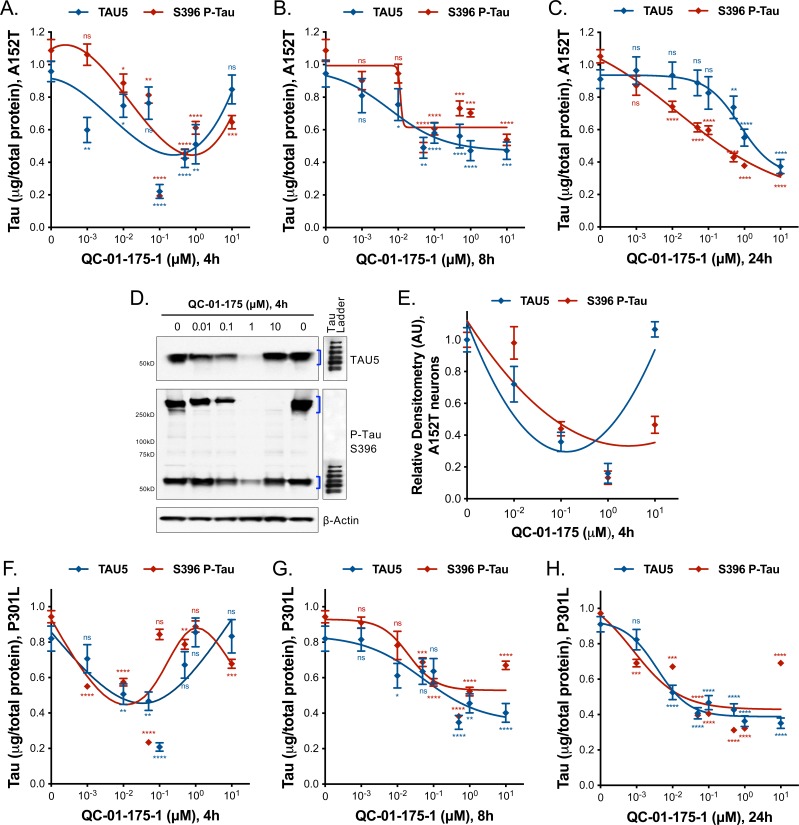
Figure 5. Comparative analysis of the effect of QC-01–175 at (A).
0.01 μM, (B) 0.1 μM, (C) 1 μM, and (D) 10 μM after 4 hr, 8 hr or 24 hr of treatment. Graph bars represent mean levels of total tau (TAU5) and S396 P-tau protein measured by ELISA, normalized to total μg of protein and to vehicle-treated samples ± SEM (n = 3), in A152T 6-week differentiated neurons. Student T-test for each dose/time is relative to vehicle-treated tau levels nsp> 0.05, *p<0.05, **p<0.01, ***p<0.001, ****p<0.0001. Figure 5—figure supplement 1 shows concentration effect curves for QC-01–175 at 4 hr and 8 hr, for all doses tested in A152T and P301L neurons; as well as the 4 hr effect seen by western blot. Figure 5—source data 1 includes all values plotted in the main Figure and supplement. The following figure supplement is available for Figure 5.


