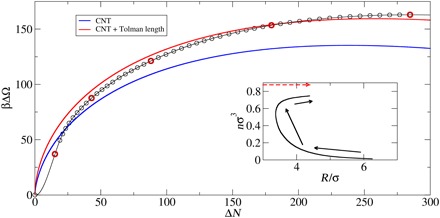
Fig. 2. Droplet free-energies as a function of size as determined from CNT and the present theory.

Nucleation pathway for a cluster of 286 molecules at kBT = 0.475ε and supersaturation S = 2.2, displayed as the excess grand canonical free energy (i.e., relative to the weak-solution free energy) versus the excess number (relative to the weak solution) of particles in the simulation cell (which is effectively the number of particles in the cluster). The blue line is the prediction of CNT, and the red line is the result of allowing the surface tension (γ) to depend on the radius (R) of the cluster [γ = γ0(1 + l/R)] and fitting to the larger clusters (those with ΔN > 100) with the result that the Tolman length l = 0.232σ. The images marked in red are shown in subsequent figures. The inset shows the cluster radius (based on the radius of gyration, as described in the text) and the average density for particles within the sphere of radius R. The arrows indicate the direction of movement along the MLP. The broken line is the CNT path.
