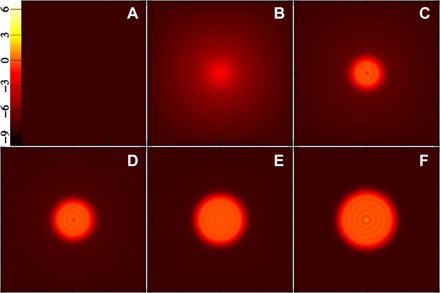
Fig. 3. Snapshots of slices through the strong-solution clusters along the nucleation pathway, leading to the critical cluster composed of about 286 molecules.

The images show the density on a logarithmic color scale ranging from black [ln(nσ3) = −10 or lower] to red to yellow to white [ln(nσ3) = 7 or higher]. (A) Point at the origin of Fig. 2, i.e., the pure weak solution. Counting from that one, (B) to (F) correspond to points 1, 10, 20, 35, and 49, respectively, with the latter being the final point, i.e., the critical cluster.
