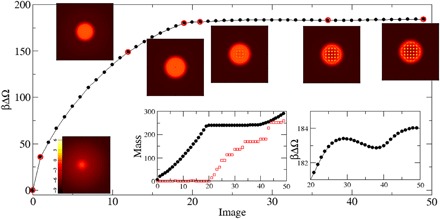
Fig. 5. Nucleation pathway for a cluster of approximately 286 growth units: The lines and points plot the excess free energy along the path as a function of an abstract reaction coordinate.

Inset images show the log of the density on a slice through the center of the cluster for the free energy points outlined in red. The inset graph on the left shows the mass of the cluster (black symbols) and the number of density peaks above a threshold of nσ3 > 5 (red symbols), which is a measure of the number of “solid” molecules; the one on the right is a magnified look at the free energy in the latter stages of the process. The path displays the two-step mechanism consisting of the formation of a droplet followed by freezing at constant mass. As shown in the magnified view, the free energy also contains a shallow minimum after the initial barrier. An examination of the images shows that the minimum is due to the completion of a crystalline shell. The free energy barrier is about 175 kBT.
