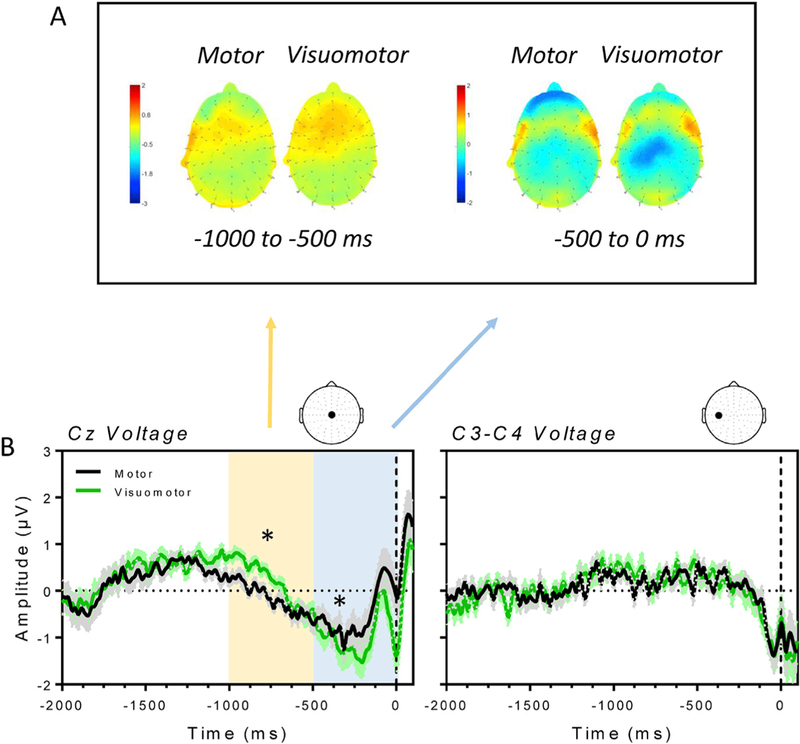
Fig. 2.

A) Scalp map for the motor and visuomotor condition averaged across two temporal windows. From 1000 to 500 ms before the button press (left panel) and from 500 ms to the onset of the motor action (right panel). The RP is initially more positive in the visuomotor as compared to the motor condition. The negative potential dramatically increases in the 500 ms before the button press with a significant difference between the two conditions. B) Average RPs (±SE; left panel) recorded from the Cz electrode and LRPs (±SE; right panel), measured as the difference between the activity at the C3 and the C4 channel, for the motor (black line) and visuomotor (green line) condition. Time 0 on the x-axis denotes the onset of the motor action. The yellow and the blue window in the left panel denote a significant difference between electric potentials measured in the motor and the visuomotor condition, the same differences reported in the scalp maps.
