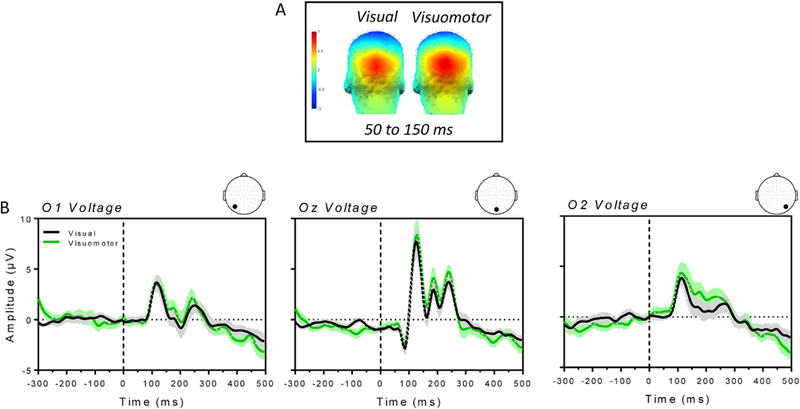
Fig. 4.

A) Scalp map for the visual and visuomotor condition averaged between 50 and 150 ms (time window of the P1) after stimulus onset. B) Average VEPs ( ± SE) recorded from the occipital Oz, O1 and O2 channels for the visual (black line) and visuomotor (green line) condition. Time 0 on the x-axis denotes the onset of the visual stimulus.
