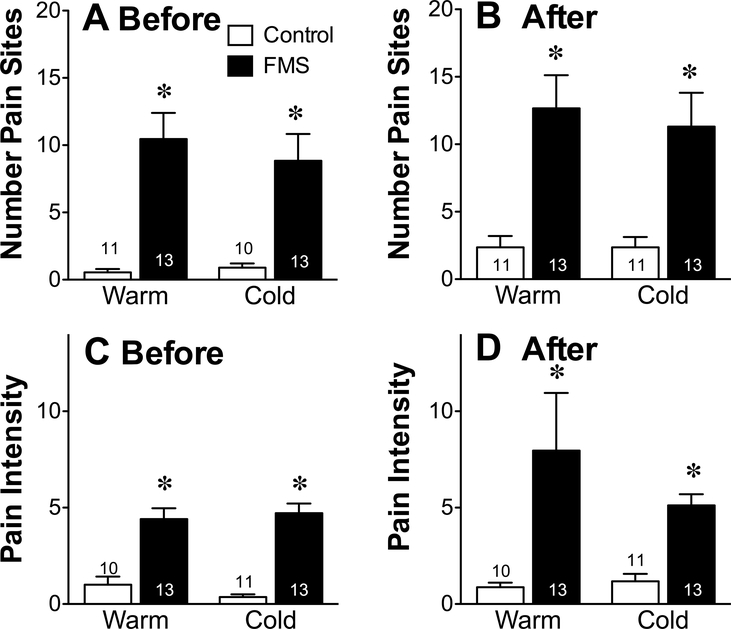
Figure 2.
Distribution and intensity of pain. The mean ± SEM number of painful sites identified on a diagram of 45 possible areas of the body (A and B) and a VAS of that pain (C and D) were assessed before (A and C) and immediately after (B and D) exposure to the warm and cold temperatures. The values of healthy controls (Control) were compared to that of patients with FMS using a two-tailed unpaired Student’s t-test with a P < 0.05 as a cutoff for statistical significance, as indicated by the asterisk.

