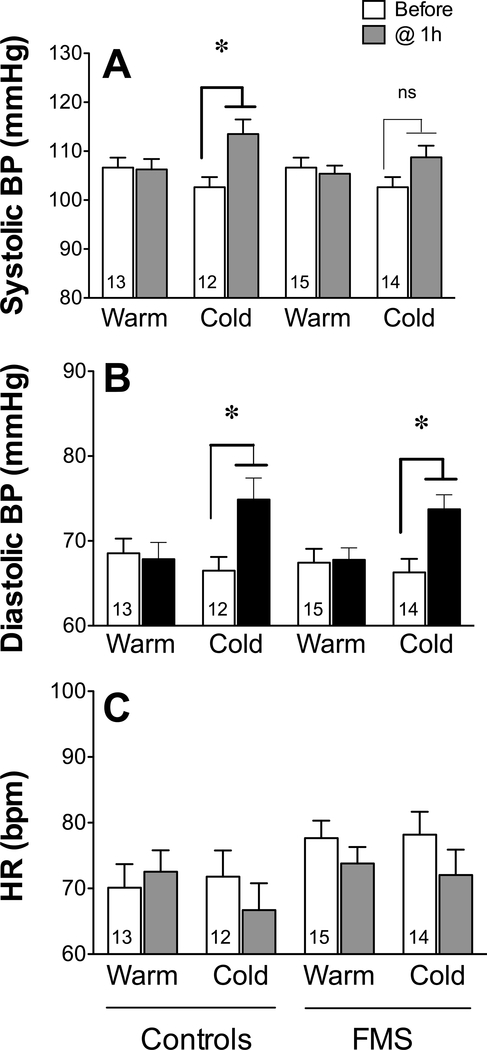
Figure 3.
Physiologic changes before and during exposure to two ambient temperatures. Values represent the mean ± SEM systolic blood pressure (BP) (A); diastolic BP (B); and heart rate (HR) (C) before and 1 h after exposure to warm and cold environments in controls and in patients with FMS. All groups A-C were analyzed using paired two-tailed Student’s t-test with a cutoff of P < 0.05 for significance, as indicated by the asterisk (significant) or ‘ns’ (not significant).

