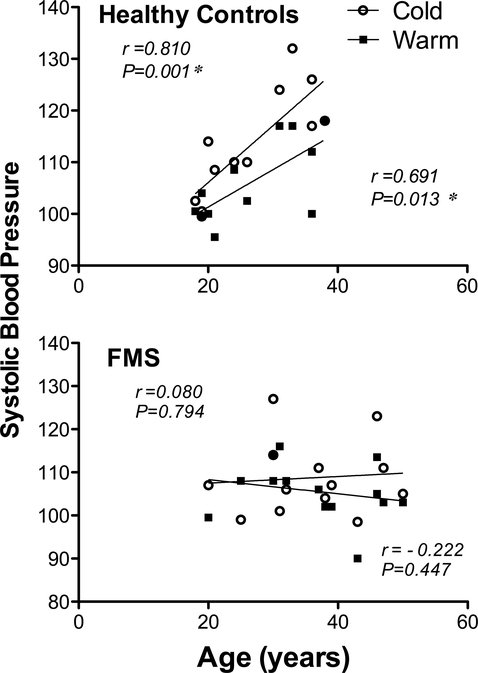
Figure 4.
Systolic BP after exposure to two ambient temperatures relative to subject age. Values represent age and systolic BP in controls and in patients with FMS 1 h after exposure to warm or cold environments. Pearson’s correlational analyses compared individual ages of subjects with their corresponding systolic BP values for each group 1 h after exposure to either warm or cold environment with a cutoff of P < 0.05 for significance, as indicated by the asterisk.

