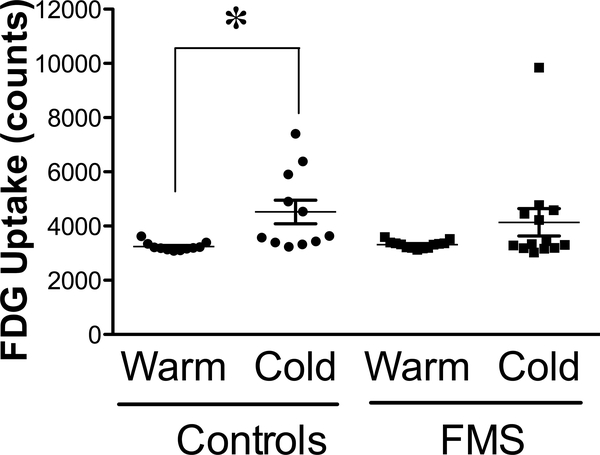
Figure 7.
Quantification of BAT activity after exposure to cool (62°F or 16.8°C) and warm (76°F or 24.4°C) ambient temperatures, as visualized using methods illustrated in Figure 5. Values reflect the mean ± SEM of FDG uptake in BAT in healthy controls (n = 10) and in patients with FMS (n = 12). One outlier occurred in the FMS patients in the cool condition and was retained for statistical analysis. Data were compared within groups after exposure to warm and to cold environments using paired two-tailed Student’s t-test with a cutoff of P < 0.05 for significance, as indicated by the asterisk (significant) or ‘ns’ (not significant).

