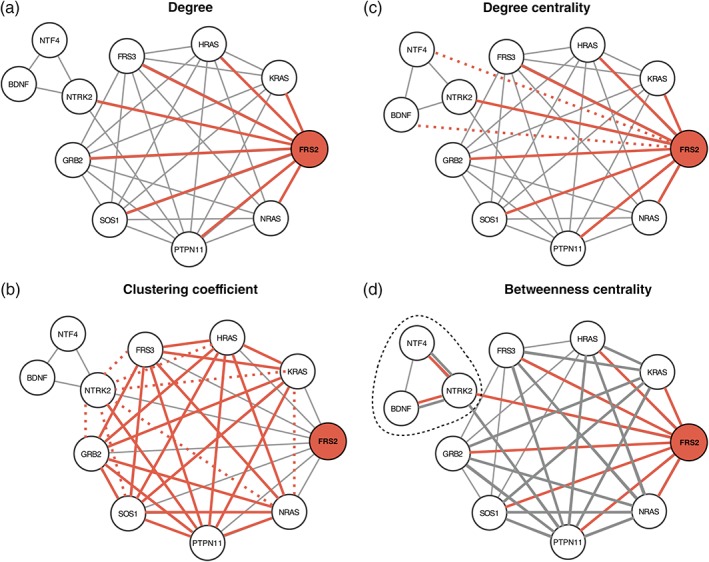
Figure 1.

Network analysis measures. PPI network of the NTRK2 activation pathway through FRS2/FRS3. (a) The degree (k) is the number of edges of a node. The degree of FRS2 is 8. The edges are highlighted in red. (b) The clustering coefficient C of a node is calculated as the ratio between the connected triangles (delimited by the solid red and gray lines) and the total number of possible triangles k × (k − 1). The dashed lines represent the unbound triangles. For FRS2, C is 0.75 (21/28). (c) The degree centrality (C D) of a node is the number of edges divided by the total number of possible edges. The C D of FRS2 is 0.8 (8/10). Red dotted lines represent the missing edges. (d) The betweenness centrality (B) is the sum over all the possible pairs of the fraction of shortest path passing through a node (red) divided by the total number of shortest paths. B of FRS2 is 9.167 (18 × 0.5 + 0.167). Gray edges are part of the shortest paths not passing through FRS2. In this example, edge length is determined by the layout algorithm and does not have a quantitative interpretation
