
Figure 2.
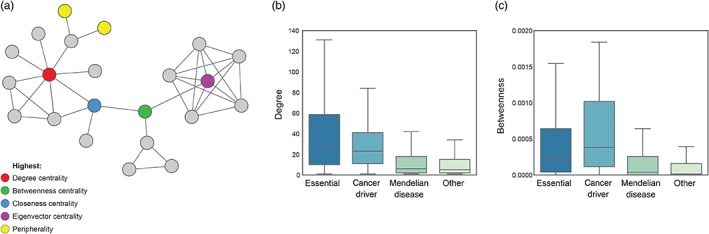
Exploring network topology as a determinant of gene–phenotype relationships. Topological location within the network has implications for biological function. (a) Nodes can be described with respect to particular characteristics in the network, including high degree hubs (red), nodes at the periphery (yellow) and nodes with the highest centrality according to four popular measures of centrality. We calculated network measures including (b) degree and (c) betweenness centrality for four groups of genes: 1,371 essential genes (Hart et al., 2015), 125 cancer genes (Vogelstein et al., 2013), 2,921 Mendelian disease genes (Stenson et al., 2017), and 7,099 other genes based on the latest release of STRING (Szklarczyk et al., 2017) to illustrate the types of observation that have been revealed by systematic studies of genes with respect to location in the interactome