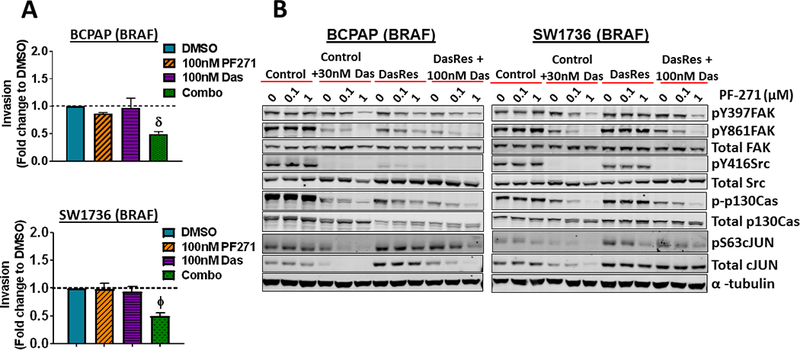
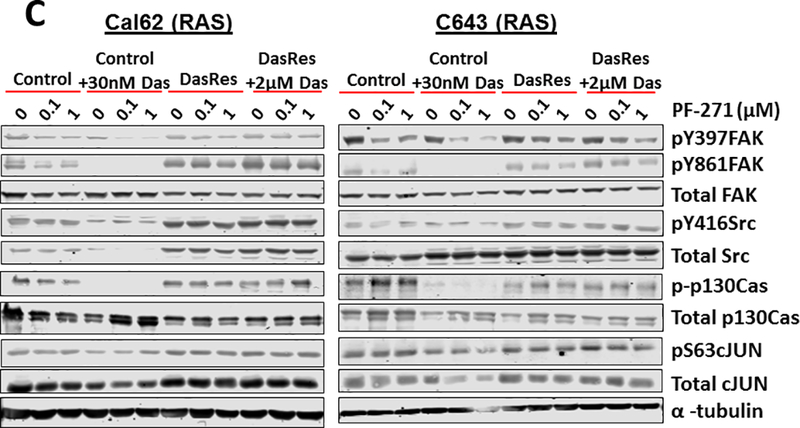
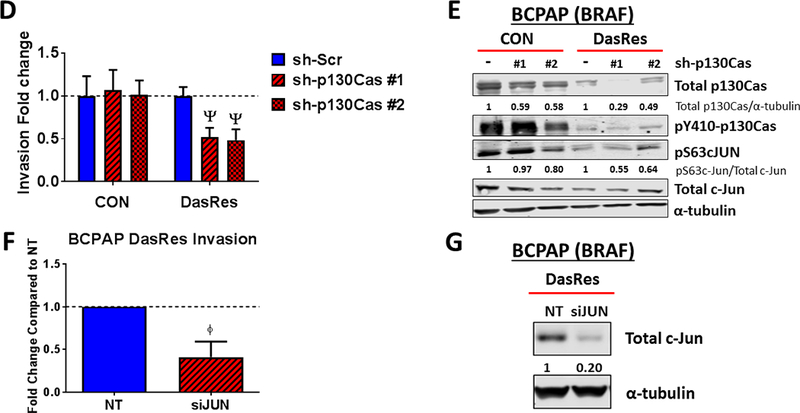
Figure 2. Combined FAK and Src inhibition blocks invasion in the BRAF-mutant DasRes cells, which correlates with inhibition of FAK, p130Cas, and c-Jun.


(A) Invasion of DasRes cells after 24 hours in the presence of DMSO, 100 nM PF-562,271, 100 nM dasatinib, or the combination of 100 nM PF-562,271 and 2𝜇M dasatinib was quantified. Results were normalized to DMSO-treated control set to 1. Results shown are mean ± SEM of 3 independent experiments performed in duplicate. Data were analyzed with a paired t-test. (B-C) Western blot analysis was performed on cells treated with the indicated concentrations of PF-562,271 and/or dasatinib for 24 hours. At least 3 independent experiments were performed for each cell line. Representative blots are shown. (D) BCPAP Control and DasRes cells were stably transfected with a scramble (Scr) control shRNA or shRNAs targeting p130Cas (sh-p130Cas #1 and #2). Invasion was performed on Scr and sh-p130Cas-expressing cells and data from each cell line was normalized to Scr expressing cells. Results shown are mean ± SEM of 3 independent experiments performed in duplicate. Data was analyzed by paired t-test. (E) Western blot analysis was performed on 3 independent cell lysates and a representative blot is shown. Quantification was performed on 3 independent experiments and the average is shown. (F) Invasion was performed on BCPAP DasRes cells transfected with nontargeting siRNA (NT) or siRNA targeting c-Jun. Data from each cell line was normalized to Scr expressing cells. Results shown are mean ± SEM of 3 independent experiments performed in duplicate. (G) Western blot analysis was performed on 3 independent cell lysates and a representative blot is shown. Quantification was performed on 3 independent experiments and the average is shown. DasRes cells were maintained in 2 μM dasatinib unless otherwise indicated. Symbols indicate * p≤0.05, Φ p≤0.01, δ p≤0.001, and Ψ p≤0.0001.
