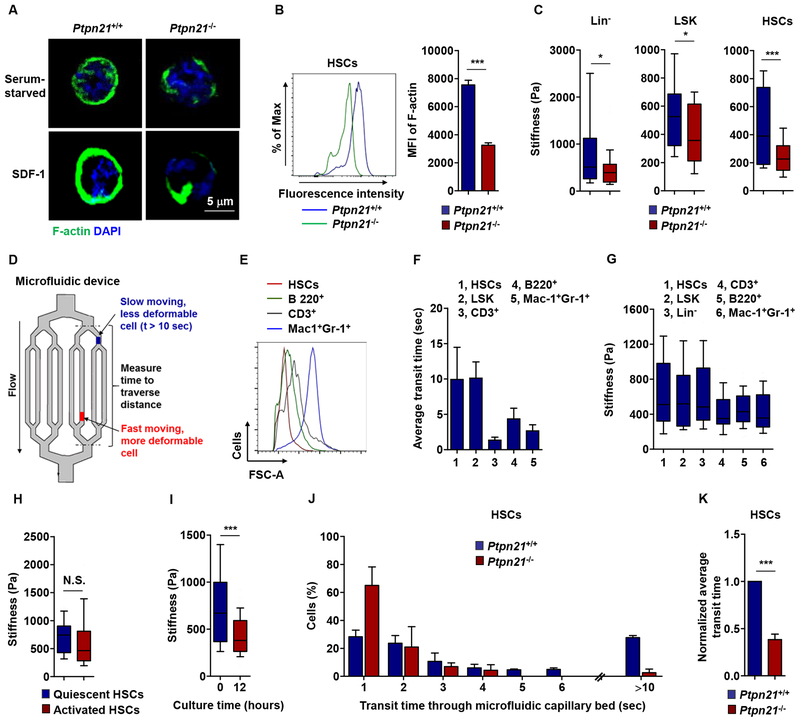
Figure 5. Loss of Ptpn21 Decreases Cell Stiffness and Increases Mobility in HSCs.
(A) HSCs sorted from Ptpn21−/− and Ptpn21+/+ mice (n = 4 per genotype) were serum starved for 4 hours followed by stimulation with SDF-1 (100 ng/mL). The cells were then subjected to fluorescence staining for F-actin followed by counterstaining with DAPI. Confocal microscopy images shown are representative of >100 cells examined for each genotype. (B) BM cells freshly harvested from Ptpn21−/− and Ptpn21+/+ mice (n = 4 per genotype) were immunostained with antibodies recognizing HSC markers. Cells were then fixed, permeabilized, and fluorescence stained for F-actin. Mean fluorescence intensity (MFI) in the gated HSC population was quantified by FACS. (C) Lin− cells, LSK cells, and HSCs isolated from Ptpn21−/− and Ptpn21+/+ mice (n = 3–7 per genotype; 28 cells examined per mouse sample) were measured for stiffness by Atomic-force microscopy (AFM). (D) A microfluidic device composed of small microchannels used to measure relative cell deformability. (E) Relative cell sizes of purified HSCs, CD3+, B220+, and Mac1+Gr-1+ cells were determined by FACS based on forward scatter (FSC-A). (F and G) HSCs, LSK, Lin−, CD3+, B220+, and Mac1+Gr-1+ cells isolated from healthy C57BL/6 mice (n = 4 mice; 26 cells examined per mouse sample) were assessed by microfluidic assays. Transit time through the device was documented (F). Mechanical stiffness of these cells was measured by AFM (G). (H) HSCs in the G0 (quiescent) and G1/S/G2/M (activated) phases were sorted separately and measured for cell stiffness (n = 4 mice; 29 cells examined per mouse sample). (I) HSCs sorted from healthy C57BL/6 mice were cultured in 50 ng/mL SCF, 50 ng/mL Flt3L, 20 ng/mL IL-3, and 20 ng/mL IL-6 containing medium for 12 hours. Cells were then collected and measured for cell stiffness (n = 3 mice; 40 cells examined per mouse sample). (J and K) HSCs isolated from Ptpn21−/− and Ptpn21+/+ mice (n = 4 per genotype) were assayed by the microfluidic system. Cells in transit were recorded using a bright-field microscopy and transit times were manually calculated (I), and average transit times are determined (J). See also Figure S5.

