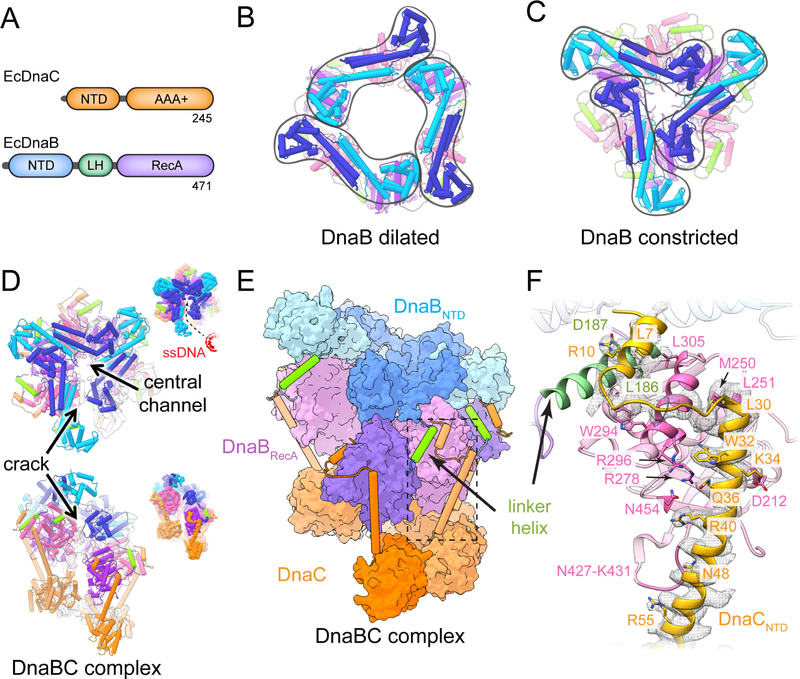
Figure 1. Structure of DNA-free E. Coli DnaBC. See also Figure S1 and S2.
(A) Primary structure of E. coli DnaC and DnaB. Color scheme is maintained throughout all figures.
(B) Dilated conformation of DnaB (PDB 2R6A (Bailey et al., 2007)).
(C) Constricted conformation of DnaB (PDB 4NMN (Strycharska et al., 2013)).
(D) Two orthogonal views of E. coli DnaBC. Insets depict the unsharpened EM density to highlight the gap in the structure. In the upper panel, an entry pathway for ssDNA has been highlighted.
(E) View of E. coli DnaBC highlighting domain structure and organization.
(F) Detailed view of the boxed area in (E) showing the interaction network between DnaB and DnaC. Density contoured at a threshold value of 0.05.

