
Figure 2.
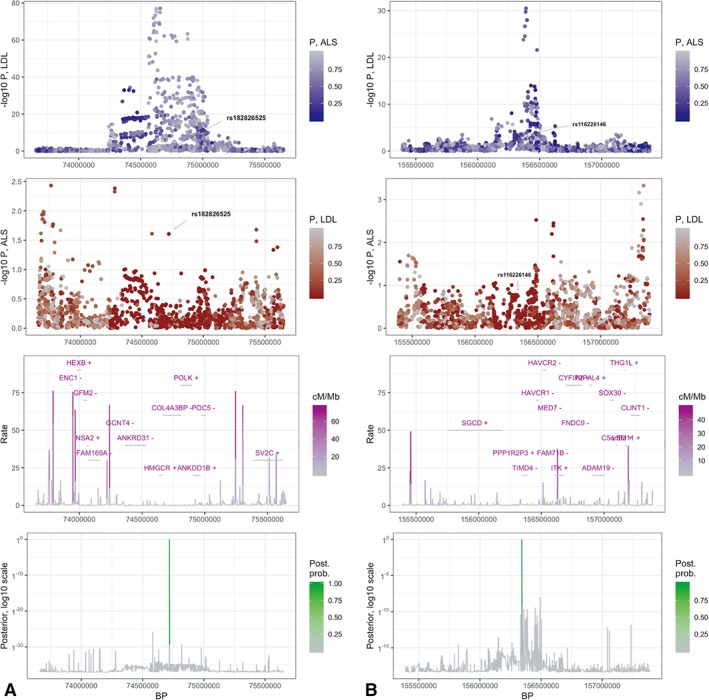
Bayesian colocalization plots. A plot and B plot represent two independent LDL‐cholesterol–associated regions with posterior probability greater than 95% of sharing a causal variant involved in ALS. Panels in column A show the region spanning chr5:73656720‐75651786 where rs182826525 is likely the shared causal variant with a posterior probability of nearly 100%. Panels in column B show the region spanning chr5:155390511‐157388284 where rs116226146 is likely the shared causal variant with a posterior probability of 96%. The first row displays the p values from the LDL GWAS for each region. Color is coded by p values in the ALS GWAS. The second row displays the p values from the ALS GWAS for the same regions. Color is coded by p values in the LDL GWAS. The third row shows local gene positions (with strands denoted by ±), as well as recombination rates measured in cM/Mb.38 The bottom row shows the posterior probabilities of a shared causal variant between LDL cholesterol and ALS. ALS = amyotrophic lateral sclerosis; GWAS = genome‐wide association study; kb = kilobases; LDL = low‐density lipoprotein.