Figure 3.

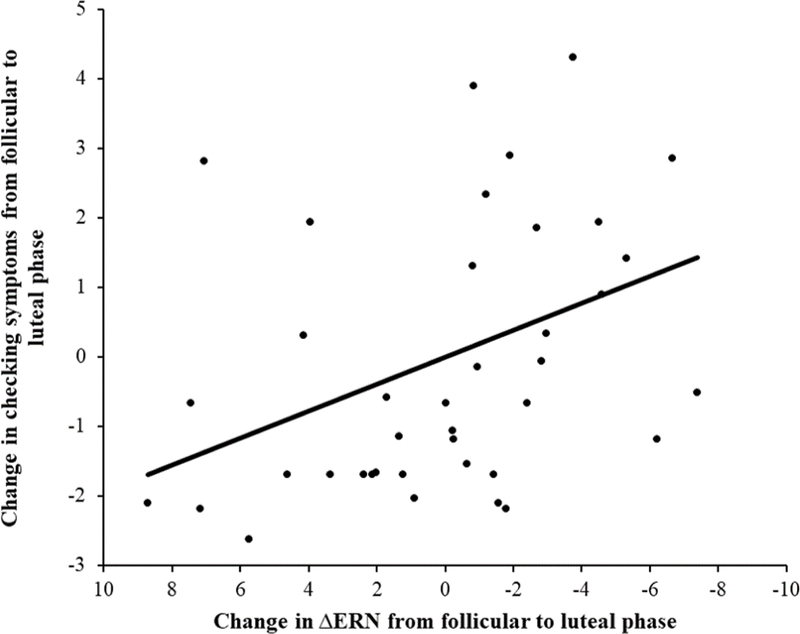
Scatter plot depicting the association between change in ΔERN from the mid-follicular to the mid-luteal phase, and change in checking symptoms from the mid-follicular to the mid-luteal phase. The line represents the line of best fit.

Scatter plot depicting the association between change in ΔERN from the mid-follicular to the mid-luteal phase, and change in checking symptoms from the mid-follicular to the mid-luteal phase. The line represents the line of best fit.