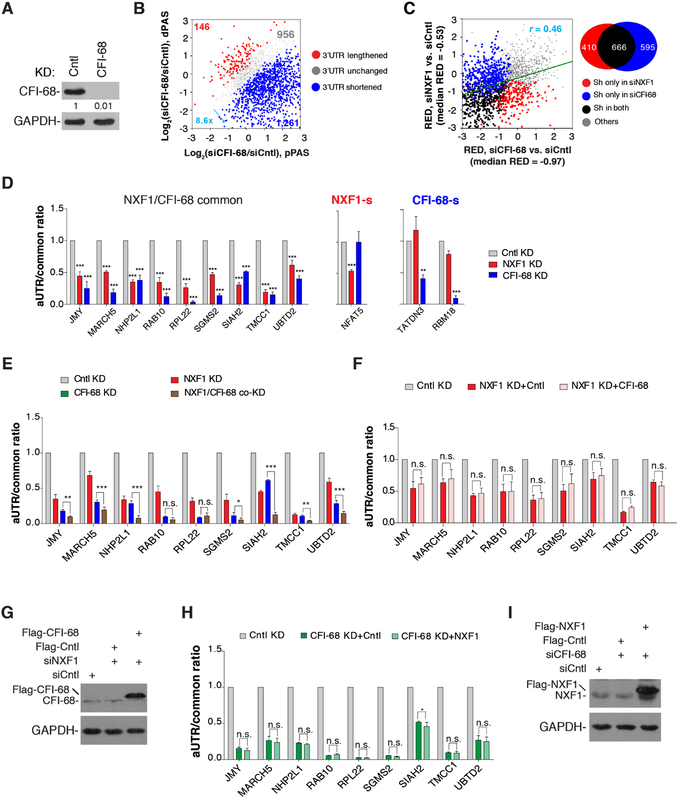
Figure 2. NXF1 regulates APA largely via a CFI-68-independent mechanism, See alsoFigure S1.
(A) Western blot analysis of knockdown efficiency of CFI-68 (72 hr KD) in HeLa cells.
(B) 3’UTR APA changes in cells treated with siCFI-68. Genes with significant 3’UTR lengthening (red) or 3’UTR shortening (blue) are indicated. The numbers of genes and ratio are shown. Significant genes are those with P < 0.05 (Fisher’s exact test) and isoform abundancechange >5%. Only the two most abundant isoforms for each gene were analyzed.
(C) Correlation of 3’UTR APA regulation between CFI-68 KD and NXF1 KD cells. RED value is used to indicate the extent of APA regulation. A Venn diagram is shown on the right to indicate the numbers of genes in different groups. Sh, genes with shortened 3’UTRs.
(D) Left, genes commonly regulated by NXF1 and CFI-68; Middle, NFAT5 is regulated by NXF1 only; right, TATDN3 and RBM18 are regulated by CFI-68 only. Ratios of RT-qPCR signal of aUTR to that of common region are shown. Data are shown as mean ± s.d..
(E) Additive effects of CFI-68 and NXF1 KDs. Ratios of RT-qPCR signal of aUTR to that of common region are shown. Data are shown as mean ± s.d..
(F) Overexpression of CFI-68 in NXF1 KD cells does not rescue APA events commonly regulated by CFI-68 and NXF1. Data are shown as mean ± s.d..
(G) Western blot examining overexpression of CFI-68.
(H) Overexpression of NXF1 in CFI-68 KD cells does not rescue APA events commonly regulated by CFI-68 and NXF1. Data are shown as mean ± s.d..
(I) Western blot analysis examining overexpression of NXF1.

