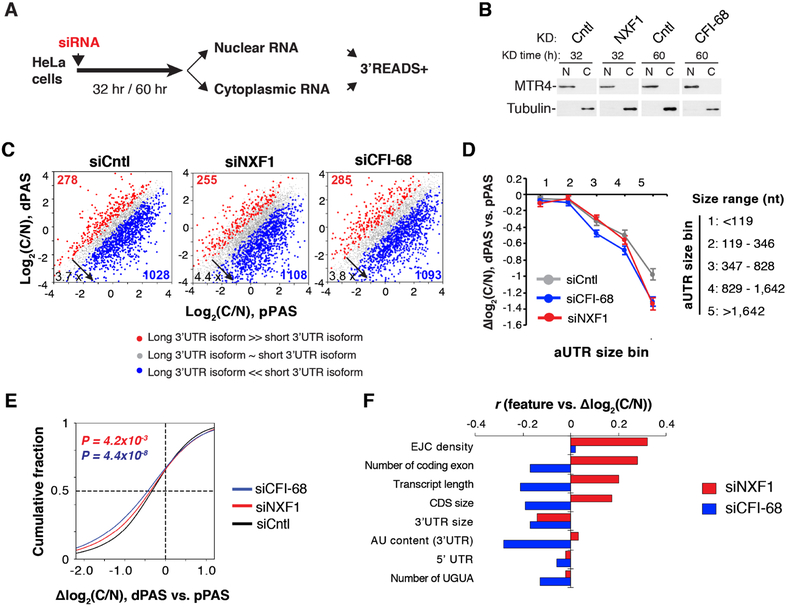
Figure 6. Differential impacts of NXF1 on nuclear export of different transcripts, See alsoFigure S5.
(A) Schematic of experimental design.
(B) Western blot analysis to examine purity of nuclear and cytoplasmic fractions. MTR4 and Tubulin served as nuclear and cytoplasmic markers, respectively.
(C) 3’UTR APA isoform abundance difference between cytoplasm and nucleus (C/N, log2) in siCntl, siNXF1, and siCFI-68 cells.
(D) Genes were divided into five bins based on aUTR size. Median Δlog2 (C/N) between dPASand pPAS isoforms in each gene bin is shown for siNXF1 (red), siCFI-68 (blue) or siCntl (gray) cells. Data are shown as mean ± s.d..
(E) Cumulative distribution of C/N difference between 3’UTR isoforms in siNXF1 (red line), siCFI-68 (blue line) or siCntl (black line) cells.
(F) Correlation between gene features and Δlog2 (C/N) of transcripts in siNXF1 or siCFI-68 cells.

