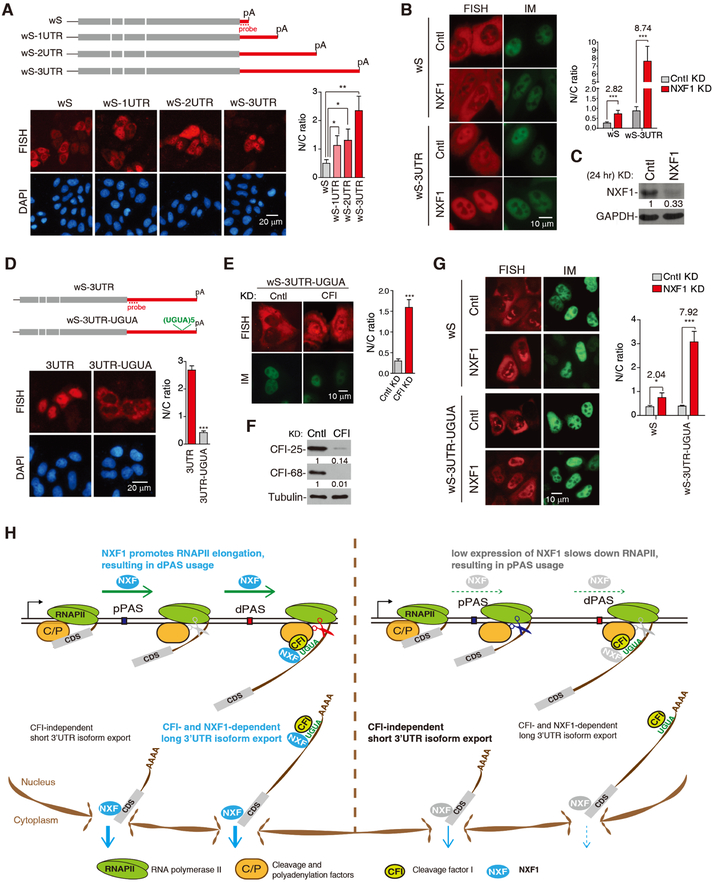
Figure 7. NXF1 and CFI-68 cooperatively facilitate nuclear export of mRNAs with long 3’UTRs, See alsoFigure S6.
(A) Top, schematic of Smad constructs. Bottom, FISH to detect the N/C distribution of Smad reporter mRNAs at 8 hr after transfection. The graph shows N/C ratios of different reporters. Data are represented as mean ± s.d..
(B) DNA constructs were microinjected into the nuclei of Cntl or NXF1 KD (24 hr) cells, followed by FISH and DAPI staining 2 hr post-injection. The graph shows N/C ratios of mRNAs in different cells…
(C) Western blot examining the protein level of NXF1 in cells transfected with siCntl or siNXF1 for 24 hr.
(D) Top, schematic of Smad constructs. DNA constructs were transfected into HeLa cells, followed by FISH and DAPI staining 8 hr post-transfection. The graph shows N/C ratios of mRNAs in different cells..
(E) The wS-3UTR-UGUA construct was microinjected into the nuclei of Cntl or CFI-25 and CFI-68 double KD cells, followed by FISH and DAPI staining 2 hr post-injection. The graph shows N/C ratios of the mRNA in different cells..
(F) Western blot examining the knockdown efficiency of CFI factors. (G) DNA constructs were microinjected into the nuclei of Cntl or NXF1 KD (24 hr), followed by FISH and DAPI staining 2 hr post-injection. The graph shows N/C ratios of mRNAs in different cells..
(H) A model summarizing the roles of NXF1 in coordinating transcriptional dynamics, APA and mRNA export.

