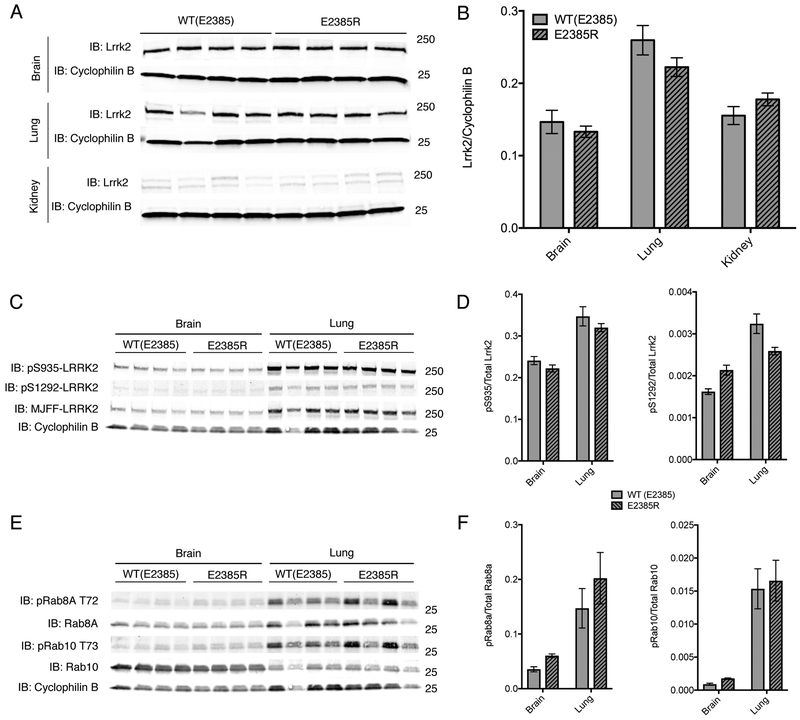
Figure 2. Knockin of E2385R in mouse Lrrk2 does not affect protein levels in vivo.
A. Protein lysates from the brain (upper panels), kidney (middle panels) or lung (lower panels) of WT or E2385R knockin mice. Each lane is a separate animal. In each tissue, cyclophilin B was used as a loading control.
B. Quantification of steady state of mouse Lrrk2 levels relative to cyclophilin B in each genotype and tissue. In kidney tissue, the double bands detected as Lrrk2 were each quantified as one band. Error bars indicate SEM, n=4 animals per genotype.
C. Protein lysates from the brain (left panel) or lung (right panel) of WT or E2385R knockin mice. Each lane is a separate animal. Cyclophilin B was used as a loading control.
D. Quantification of phospho-serine 935 and phospho-serine 1292 relative to total Lrrk2 protein in each genotype and tissue. Two-way ANOVA indicated that there was a statistically significant difference in pS935 and pS1292 phosphorylation between tissues but not between genotypes (pS935: F tissue (1, 12) = 52.51, p<0.0001; F genotype (1, 12) = 2.645, p=0.1298. pS1292: F tissue (1, 12) = 53.29, p<0.0001; F genotype (1, 12) = 0.2364, p=0.6356; n = 4 animals per genotype).
E. Protein lysates from the brain (left panel) or lung (right panel) of WT or E2385R knockin mice. Each lane is a separate animal. Cyclophilin B was used as a loading control.
F. Quantification of phospho-T72 Rab8A and phospho-T73 Rab10 relative to total Rab protein in each genotype and tissue. Two-way ANOVA indicated that there was a statistically significant difference in Rab8a phosphorylation between tissues but not between genotypes (F tissue (1, 12) = 18.07, p=0.001; F genotype (1, 12) = 0.2564, p=0.6218; n=4 animals per genotype). Similarly, twoway ANOVA indicated that there was a statistically significant difference in Rab10 phosphorylation between tissues but not between genotypes (F tissue (1, 12) = 45.55, p<0.0001; F genotype (1, 12) = 0.239, p=0.6337; n = 4 animals per genotype).

