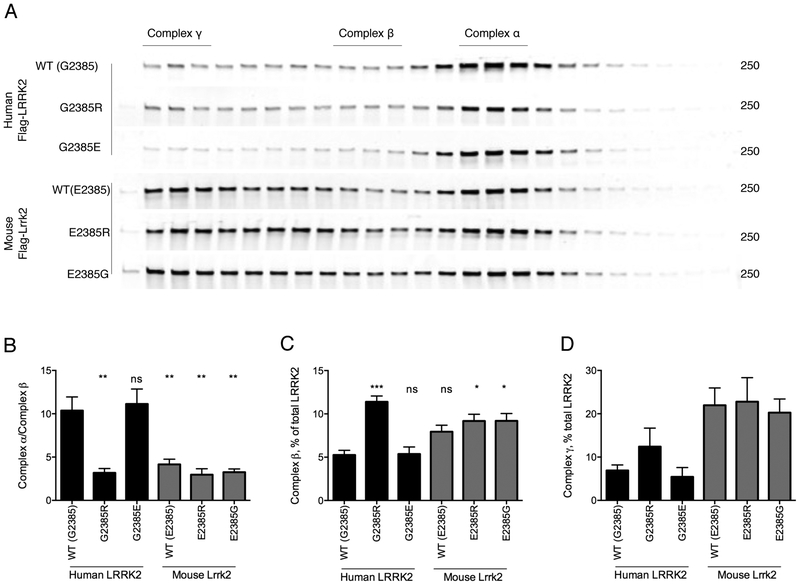
Figure 4. Differential mobility of human and mouse LRRK2 in FPLC gradients.
A. HEK293FT cells were transfected with the indicated flag-tagged human and mouse LRRK2 constructs and protein extracts separated by FPLC. Regions above the separated fragments indicate assignment of LRRK2 to each of three major complexes, α,β,γ.
B-D. Quantification relative amounts of LRRK2 in complex a relative to complex b (B), complex b relative to all LRRK2 (B) and complex g relative to all LRRK2 (C) from n=3 independent experiments. **, p<0.01; ***, p<0.001; ****, p<0.0001; ns, non-significant by Tukey’s post-hoc test from one-way ANOVA compared to WT human LRRK2. In each case, the underlying ANOVA showed significant differences between groups; complex a/complex b, F (5, 18) = 13.2, p<0.001; complex b/all LRRK2, F (5, 18) = 10.5, p<0.001; complex g/all LRRK2, F (5, 18) = 4.44, p=0.0082.

