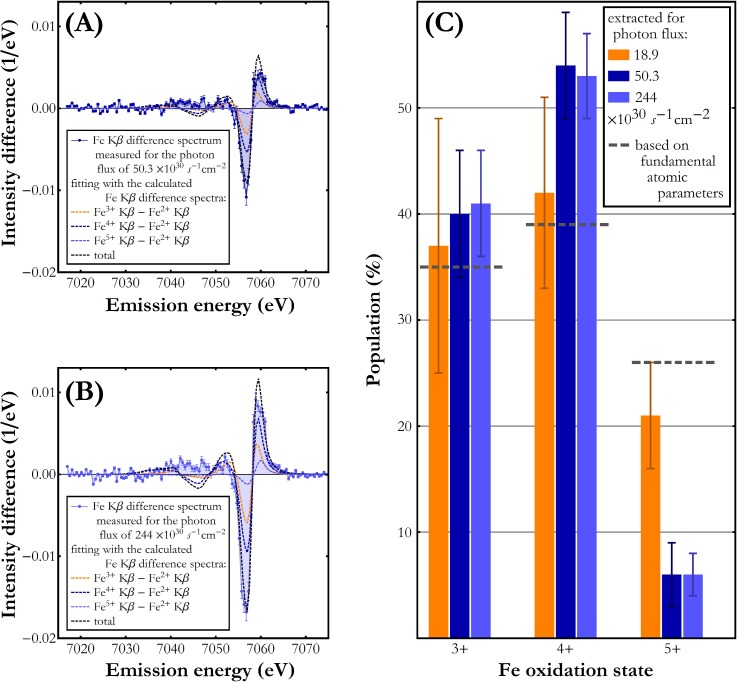
FIG. 4.
Fitting a linear combination of the calculated difference spectra to the difference spectra measured for the photon flux of (a) 50.3 × 1030 photon/(s cm2) and for the photon flux of (b) 244 × 1030 photon/(s cm2). Only the experimental data points in the energy range 7048 eV–7068 eV were considered in the fitting procedure. The fit components corresponding to the Fe3+-Fe2+, Fe4+-Fe2+, and Fe5+-Fe2+ spectral changes are plotted as orange, dark blue, and light blue dashed lines, respectively. A black dashed line marks the total of the fit components' linear combination. (c) Relative populations of Fe oxidation states 3+, 4+, and 5+.

