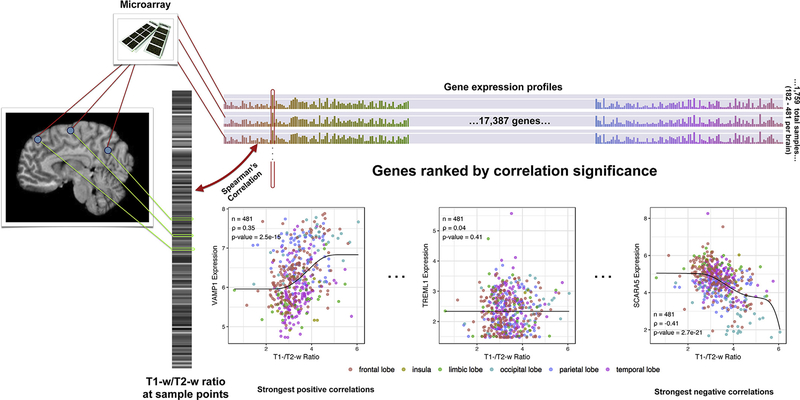
Fig. 1.
Overview of the correlation analysis. MR intensities are extracted from the images on the left, depicted as a single grayscale vector which each bar corresponding to an Allen Atlas sample. The colored bar on top visualizes the expression matrix with samples as rows and genes as columns. Each gene/column forms an expression profile across the cortex (outlined in red) and is correlated with the grayscale intensity vector. Genes are then sorted from strong positive to strong negative correlation for gene set enrichment analysis to test if a particular set is enriched for positive or negative correlations. VAMP1 (high positive correlation), TREML1 (no correlation), and SCARA5 (strong negative correlation) provide examples across the correlation range using data from donor H0351.2001.

