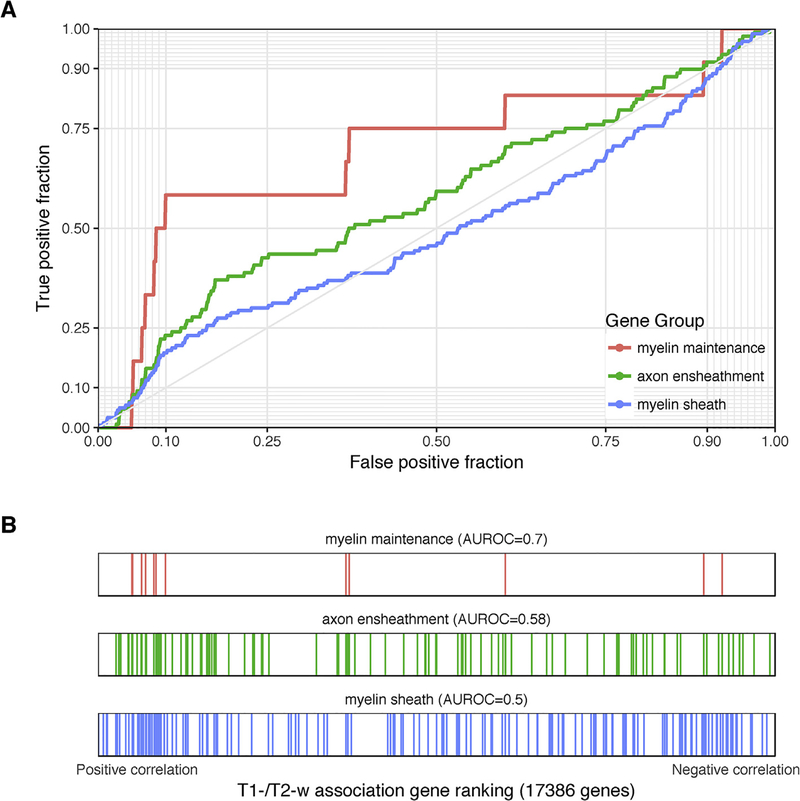
Fig. 3.
Associations with T1-w/T2-w ratio intensities for selected myelin-related GO groups. (A) ROC curves for GO groups selected from Table 1. The curves show the proportion of GO group genes that overlap (y-axis, true positive fraction) in varying lengths of the T1-w/T2-w gene ranking (approximated by the x-axis, false positive fraction). Colored lines mark genes in different GO groups. (B) Distributions of the three significant GO groups across the T1-w/T2-w associated gene ranking with each annotated gene representing a single colored line.

