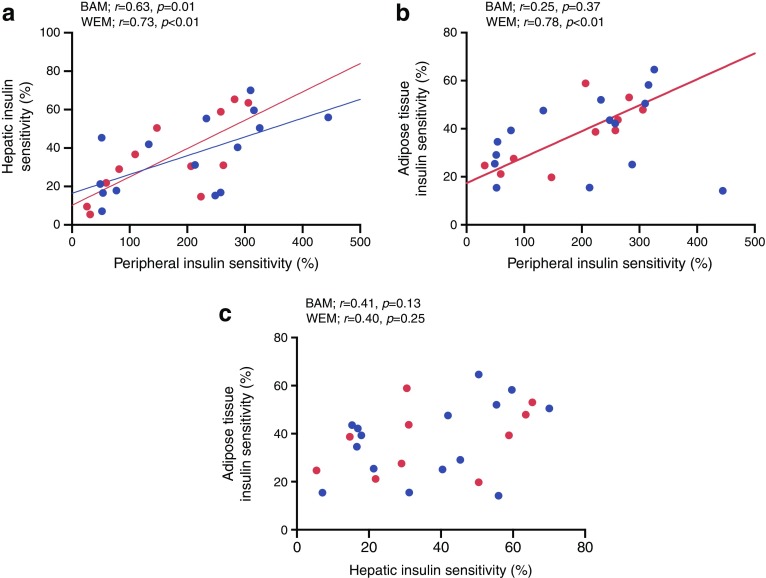
Fig. 3.
Associations between tissue-specific insulin sensitivities during the hyperinsulinaemic–euglycaemic clamp in BAM and WEM with early type 2 diabetes: (a) peripheral (calculated as the percentage increase in glucose Rd from basal to high-dose insulin infusion, 40 mU m−2 BSA min−1) and hepatic insulin sensitivity (calculated as the percentage suppression of glucose Ra from basal to low-dose insulin infusion, 10 mU m−2 BSA min−1); (b) peripheral and adipose tissue (calculated as the percentage suppression of glycerol Ra from basal to low-dose insulin infusion, 10 mU m−2 BSA min−1) insulin sensitivity; and (c) hepatic and adipose tissue insulin sensitivity. Data expressed using Pearson’s correlation coefficient with corresponding p values for BAM and WEM. Sample size: BAM, n = 15; WEM, n = 12 (except for adipose tissue insulin sensitivity analyses, where n = 10 for WEM). Blue dots and regression line, BAM; red dots and regression line, WEM

