Fig. 1.
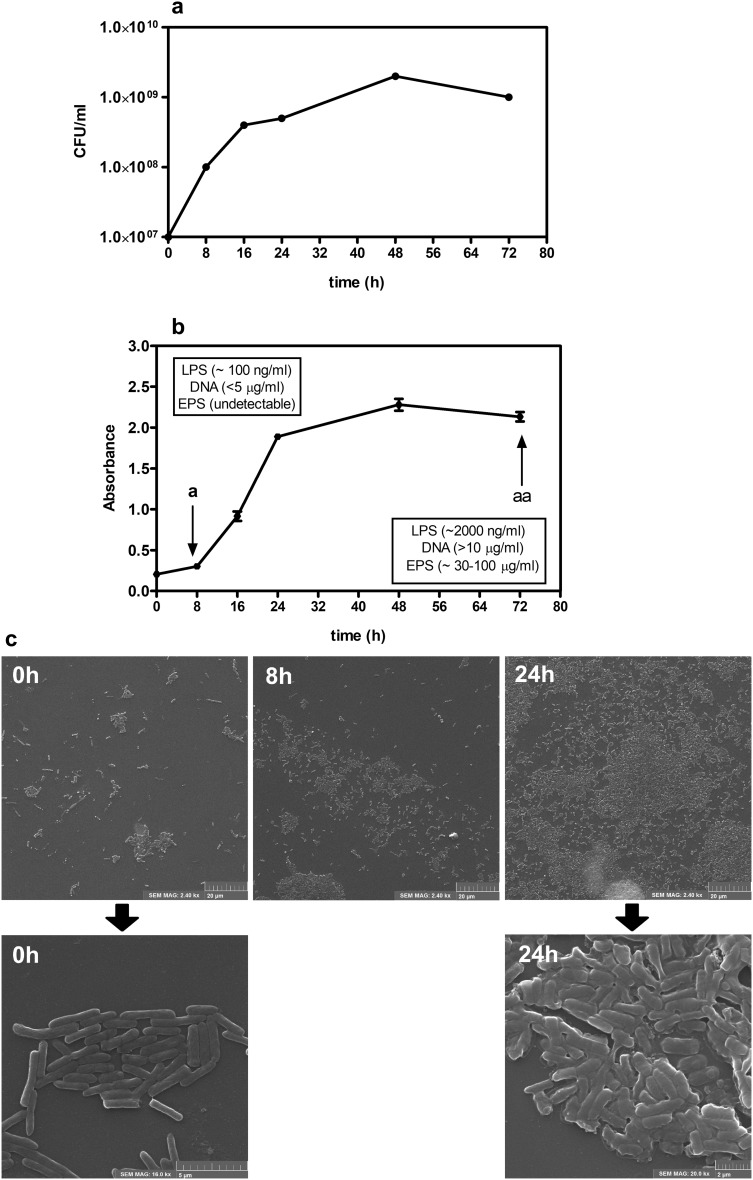
The representative record of kinetics of biofilm formation by PAR5. a Density of PAR5 population at the indicated points of time is expressed in CFU of sessile cells per ml. The culture started with the bacterial suspension at a density of 107 CFU/ml. b Building of biofilm matrix. Congo red staining was used for measuring biofilm formation (EPS accumulation). Plot depicts mean values ± SD of absorbance (λ = 492 nm). The mean was calculated on the basis of three independent experiments (n = 3). a8-h PAR5 planktonic bacteria cell attachment and the beginning of biofilm formation aa72 h—mature biofilm. At these time points of the culture, the concentration of DNA, LPS and EPS in bacterial conditioned media is shown. c SEM of: 0-h PAR (free-floating planktonic bacteria); 8-h PAR5 (cluster of planktonic bacteria, the beginning of biofilm formation); 24-h PAR5 (conglomerate cluster of bacteria—early biofilm)

