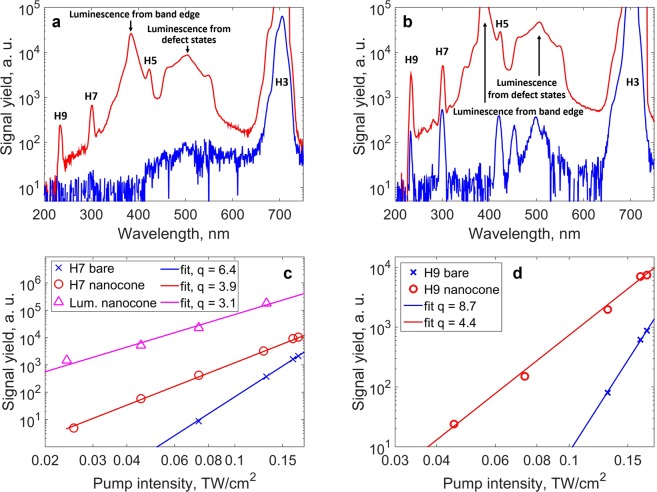
Figure 3.
Intensity-dependent signal yield. (a,b) Spectra emitted from the ZnO cone (red curve) and from the bare crystal (blue curve) measured at pump intensities of 0.07 TW/cm2 and 0.17 TW/cm2, respectively. The harmonics H3, H5, H7 and H9 are highlighted as well as the luminescence from the band edge at 385 nm and from defect states. (c,d) Intensity dependence and power law of the harmonic yield for H7 and H9 from the bare crystal (blue crosses) and the cone (red circles), respectively. The power law for the luminescence from the band edge generated in the cone is shown in (c) as magenta triangles.

