Figure 4.
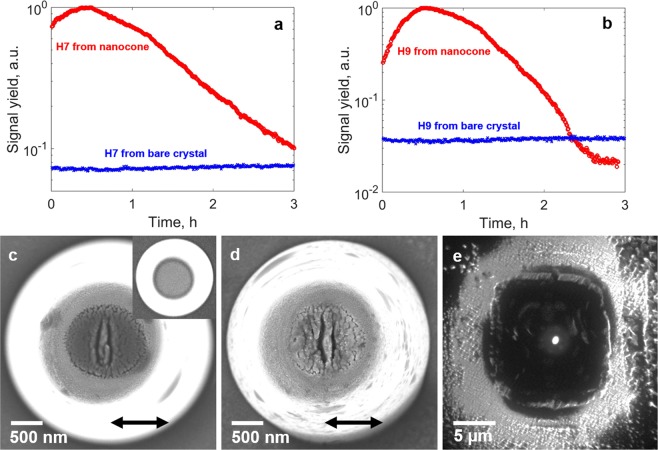
Temporal evolution of the harmonic emission. Temporal evolution of (a) H7 and (b) H9 from a cone at an intensity of 0.17 TW/cm2 (red curve). The signal is observed over a time of 3 hours. SEM-images of the top of a cone after an exposure time of half an hour and 3 hours, respectively at an intensity of 0.17 TW/cm2 are shown in (c,d). The polarization direction is indicated by a black arrow. The initial cone, before irradiation, is shown as an inset in (c). (e) Image of hot electrons emitted by the cone taken by photo-emission electron microscopy (PEEM). The cone is back illuminated by a 775 nm pulsed laser beam under an angle of 45°. The image is a superposition of two simultaneously acquired images, one recorded in low energy electron microscopy imaging mode (LEEM, topographic signature) and one in PEEM imaging mode (photoelectron signature).

