
Fig. 1.
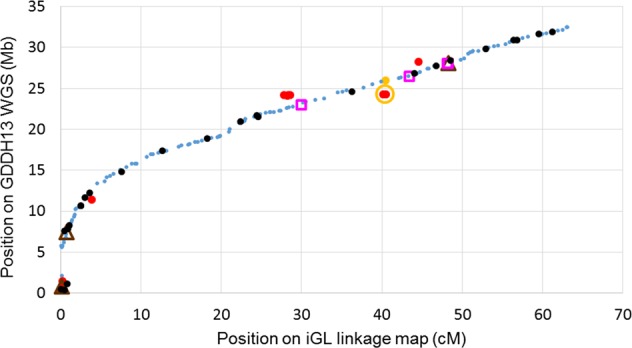
Haploblock markers of LG 1 plotted for position on the GDDH13 reference WGS compared to that on the iGL genetic linkage map.  = matching order.
  = matching after shuffling within genetic bins.
  ,
,  = the two positions of markers with two full hits on chromosome 1 whereas their cluster plots showed them to be true single locus markers; only the former position matched the iGL map (one haploblock with five SNPs jointly representing two continuous stretches of 2.9 kb with 99.8% sequence similarity).
  = cM-Mb mismatches that could not be resolved through shuffling on the iGL map and for which calls and hit-qualifications were appropriate; they matched with a 0.8 to 5.5 Mb shift along the chromosome (12 haploblocks with 35 SNPs).
  ,
,  = no hit on chromosome 1 but on another chromosome (four haploblocks with seven SNPs) or no hit at all (three haploblocks with four SNPs), respectively; their physical coordinates were estimated based on the nearest matching flanking markers on the iGL map