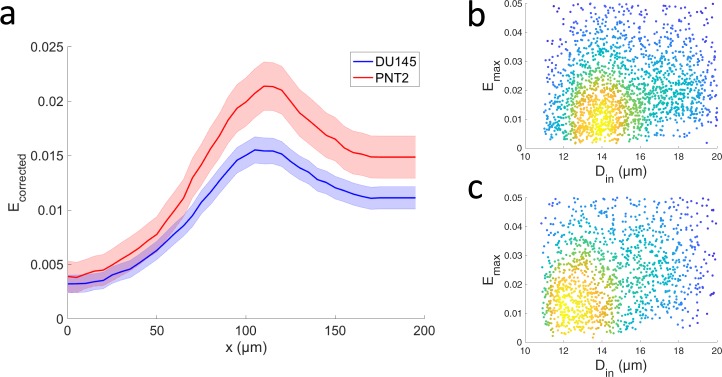
Figure 2.
Mechanical characterisation of metastatic and healthy prostate cell lines. (a) Temporal profiles of the cellular mechanical response estimated as median deviation from the perfect roundness for DU145 (n = 2199) and PNT2 (n = 2852) cells. The error bars represent the 95% confidence intervals. Data collected over 12 independent experiments. The two profiles were significantly different at all positions (p < 0.0001, Mann-Whitney U test). (b,c) Density scatterplots of the Ecorrected (maximum deviation from perfect roundness) versus the initial diameter Din of each of the DU145 and PNT2 cells analysed in (a). The density of the data points in (b,c) is given by colour, with blue corresponding to the lowest density and yellow to the highest.

