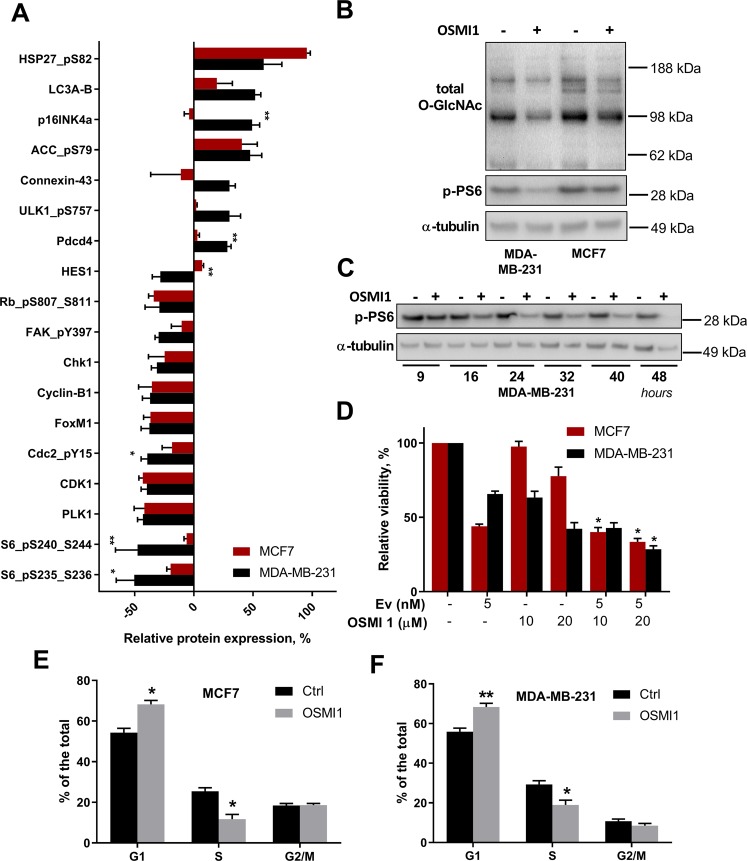
Figure 3.
OGT inhibition differentially affects proteome and phospho-proteome in MCF7 and MDA-MB-231. (A) Proteins whose expression changed by 28% or more compared to the control samples in MDA-MB-231 following 24 hours of treatment with 20 µM OSMI1, were selected. Corresponding proteins in MCF7 are shown in the same figure. RPPA array, n = 3, error bars - SEM. *p < 0.05; **p < 0.01, unpaired t-test. Significance indicates comparison of the relative protein expression changes in MDA-MB-231 and MCF7. (B) Total O-GlcNAcylation and phospho-PS6 (S235-S326) in MDA-MB-231 and MCF7 following treatment with 20 µM OSMI1 for 24 hours. (C) Phospho-PS6 (S235-S236) in MDA-MB-231 after treatment with 20 µM OSMI1 for 9, 16, 24, 32, 40 and 48 hours. (D) Viability in MCF7 and MDA-MB-231 following 72 hours of treatment with Everolimus (Ev), OSMI1 and the combination. MTS assay, error bars - SEM, n = 3. *p < 0.05, unpaired t-test. (E,F) Cell cycle distribution in MCF7 (E) and MDA-MB-231 (F), after 24 hours of treatment with 20 µM OSMI1. n = 3, error bars - SEM. *p < 0.05; **p < 0.005, unpaired t-test.

