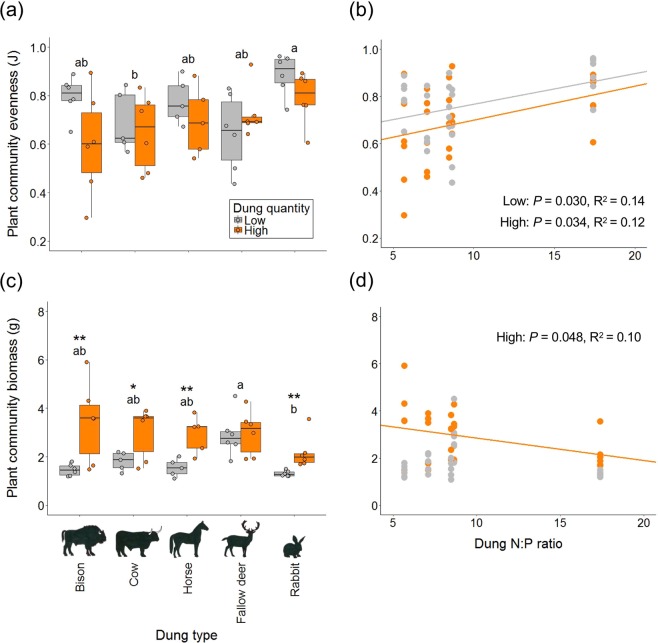
Figure 2.
The effect of dung quality and dung quantity on the evenness and total biomass of an experimental plant community. Evenness (a) and total biomass of plant communities (c) in mesocosms fertilized with a low quantity (grey boxplots and points, 5 g dry dung per mesocosm) or a high quantity (orange boxplots and points, 30 g dry dung per mesocosm) of dung from different European herbivores (European bison, cow, horse, fallow deer and rabbit). Bars show means ± SE of 6 replicates, except for low-cow, low-horse and high-horse (n = 5). Values not sharing the same letter indicate significant differences between dung types combining low and high quantity bars, since there was no significant dung type x dung quantity interaction (results from ANOVA; Table 2). Asterisks indicate significant differences in total plant biomass between dung quantities (with *P < 0.05, **P < 0.01). Plant community evenness (b) and community biomass (d) plotted against the N:P ratio of the supplied dung. Grey points show low dung quantity and orange points high dung quantity. Significant linear regression lines are shown. All plant communities consisted of the same six species with two leguminous forbs (Trifolium pratense and Lotus corniculatus), two grasses (Holcus lanatus and Agrostis capillaris), and two other forbs (Taraxacum officinale and Achillea millefolia).

