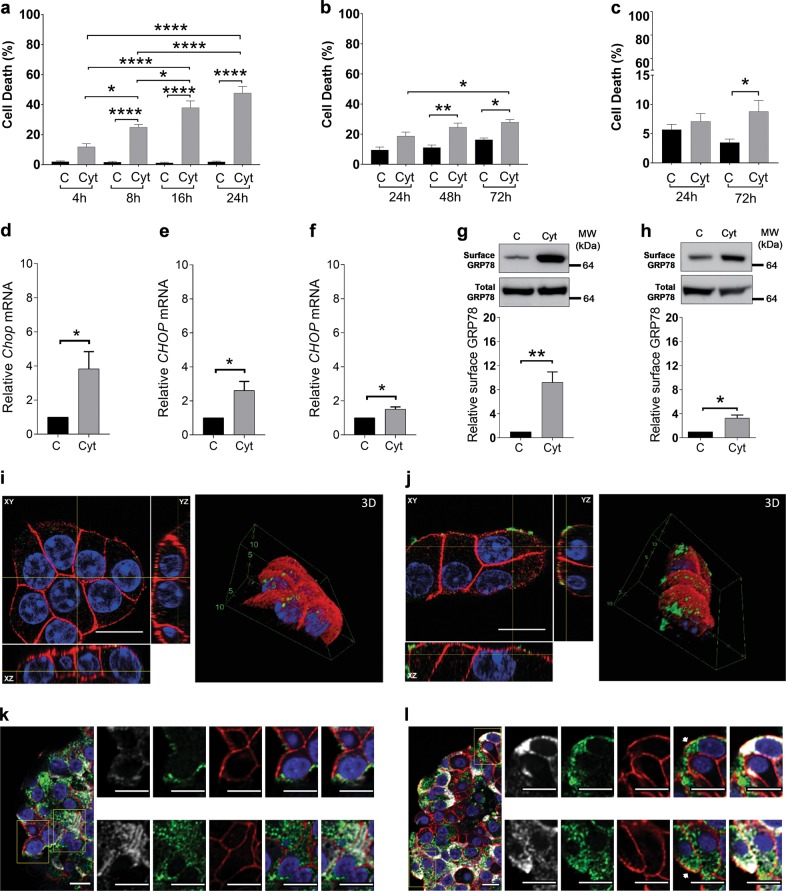
Fig. 1. Exposure of beta cells to pro-inflammatory cytokines induces surface translocation of glucose-regulated protein 78 (GRP78).
a–c Apoptosis levels in MIN6 exposed to human interleukin (hIL)-1β (50 U/ml), mouse interferon (mIFN)-γ (250 U/ml), and mouse tumor necrosis factor (TNF)-α (1000 U/ml) (n = 4) (a); EndoC-βH1 exposed to hIL-1β (50 U/ml), hIFN-γ (1000 U/ml), and mTNF-α (1000 U/ml) (n = 4) (b); and human islets exposed to hIL-1β (50 U/ml), hIFN-γ (1000 U/ml), and mTNF-α (1000 U/ml) (n = 8) (c) for the indicated time points. d–f Chop mRNA expression upon exposure to the same mix of cytokines in MIN6 (8 h, n = 4) (d), EndoC-βH1 (24 h, n = 5) (e), and human islets (24 h, n = 3) (f). g, h Surface and total GRP78 protein levels in MIN6 (g) and EndoC-βH1 (h) after 16 and 72 h cytokine exposure, respectively. Upper panels show one representative Western blot out of three independent experiments, performed on membrane fractions for surface GRP78 and on cytoplasmic fractions for total GRP78. Lower panels show the relative intensities of the different protein bands after quantification by densitometry and expressed as a ratio to the control. i, j Confocal images of live-cell staining of control (i) and cytokine-exposed (16 h) MIN6 cells (j), stained for GRP78 (green), the membrane marker β-catenin (red), and nuclei (blue). Per condition, one representative image out of three independent experiments is shown. k, l Confocal images of paraffin-embedded control (k) and cytokine-exposed (72 h) human islets (l), stained for GRP78 (green), the membrane marker β-catenin (red), insulin (white), and nuclei (blue). Per condition, one representative image out of five independent experiments is shown. Scale bars, 5 µm. Data are presented as mean ± SEM. Statistical analysis was performed by one-way analysis of variance for cell death and two-tailed Student’s t test for western blots. *P < 0.05, **P < 0.01, and ****P < 0.0001

