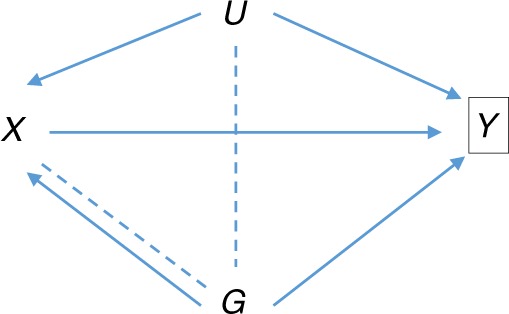
Fig. 2.

Directed acyclic graph of association of SNP G with risk factor X conditional on outcome Y. U is as in Fig. 1. For example, X may be body mass index, and Y may be type-2 diabetes, with the study design being case/control or a cohort depleted for cases, such as UK Biobank17. Conditioning on Y induces the moralised association between G and U shown by the dotted line. This creates association of G with X via the path , in addition to the direct effect G X. The direct effect itself is biased by conditioning on Y, as shown by the additional dotted line connecting G and X. The resulting selection bias is not the focus of this paper
