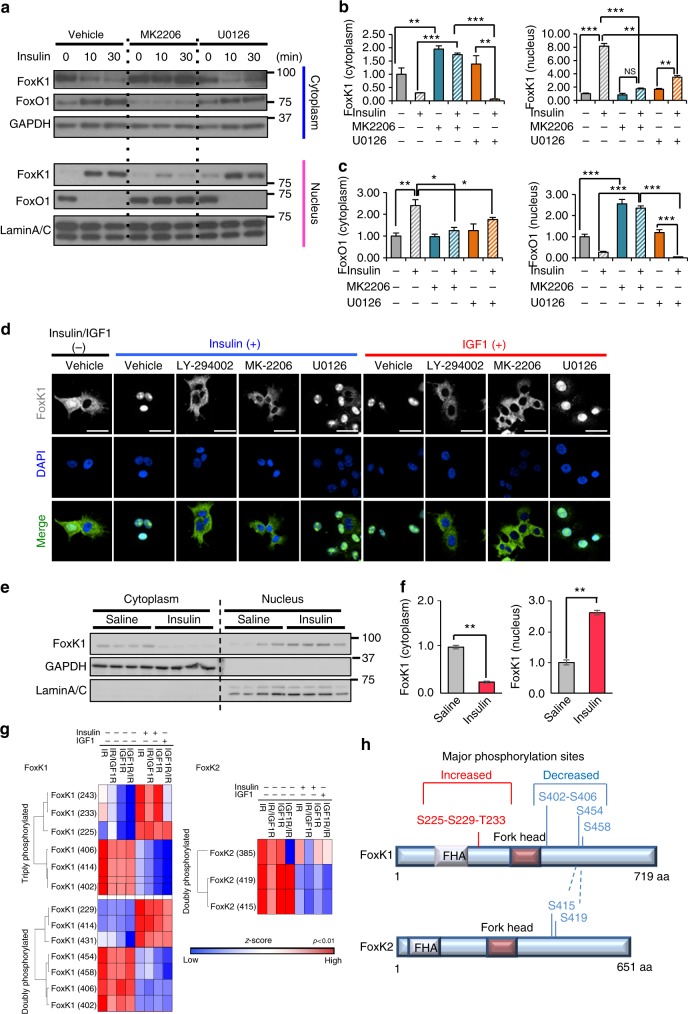
Fig. 2.
Insulin and IGF-1 regulate nuclear translocation of FoxK1 in an Akt-dependent manner. a Immunoblotting of FoxO1 and FoxK1 in nuclear and cytoplasmic fractions extracted from IR-expressing brown preadipocytes before and after stimulation with 10 nM insulin at the indicated times in the presence or absence of the Akt inhibitor MK2206 (5 μM) or the MEK1/2 inhibitor U0126 (20 μM). GAPDH is a cytosolic marker, and Lamin A/C is a nuclear marker. b, c Densitometry of FoxK1 (b) and FoxO1 (c) in the cytoplasmic fractions and nuclear fractions 30 min after insulin stimulation as in Supplementary Fig. 3a. (One-way ANOVA followed by Tukey-Kramer post hoc analysis, *P < 0.05; **P < 0.01; ***P < 0.001, n = 3). All data are represented as mean ± SEM. d Representative images of AML 12 cells immunostained for FoxK1 and DAPI before and 30 min after 100 nM insulin treatment in the presence or absence of 50 μM PI3K inhibitor LY-294002 or 5 μM MK2206 (Akt inhibitor) or 20 μM U0126 (MEK inhibitor). DAPI was used to label the nucleus. Scale bars, 50 μm. e Immunoblotting of FoxK1 in nuclear and cytoplasmic fractions extracted from 2-month-old C57BL/6 J mice liver tissues 15 min after injection of saline or 5 U insulin via the inferior vena cava. GAPDH is a cytosolic marker, and Lamin A/C is a nuclear marker. f Densitometry of FoxK1and FoxO1 in the cytoplasmic fractions (left) and nuclear fractions (right) 15 min after insulin stimulation as in Fig. 2e (two-tailed Student t-test, *P < 0.05; **P < 0.01; ***P < 0.001, n = 4). All data are represented as mean ± SEM. g Heatmap of Log2 transformed, z-score phosphosite intensities for FoxK1 and FoxK2 in the presence or absence of insulin/IGF-1 in cells expressing normal or chimeric receptors. Significant increase or decrease of the phosphorylation clusters for FoxK1 and FoxK2 after insulin/IGF-1 stimulation are shown in panel h

