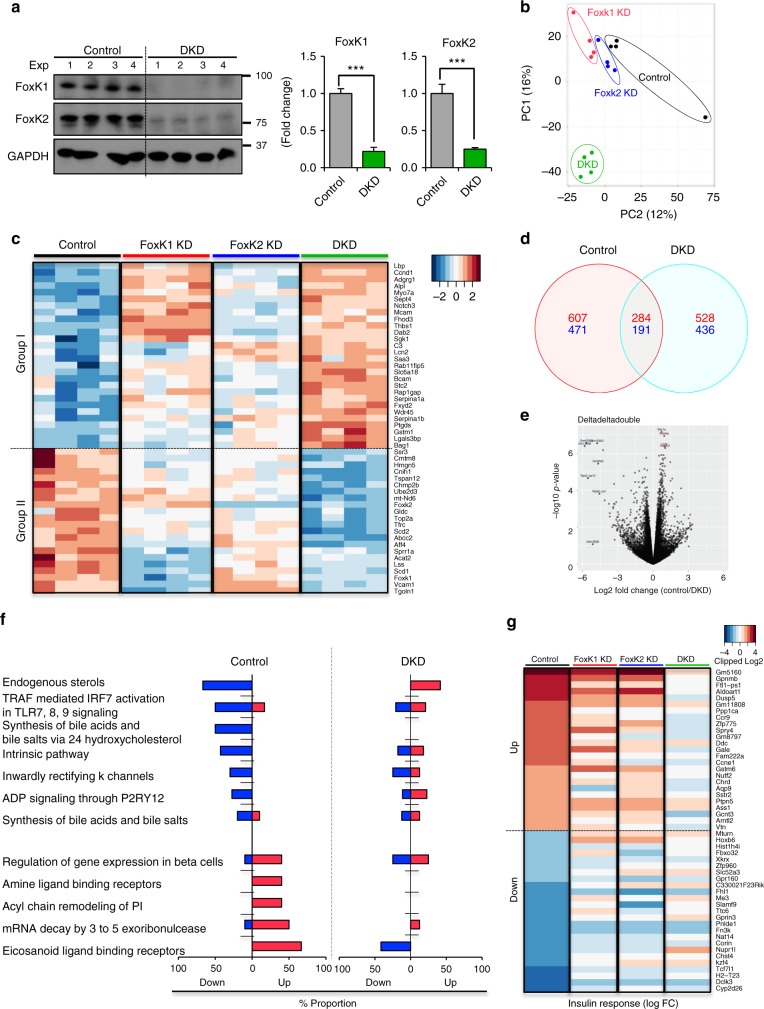
Fig. 5.
Role of FoxKs in the regulation of gene expression. a Immunoblotting of FoxK1 and FoxK2 from lysates of Control (NS siRNA) and FoxK1/K2 double knockdown (DKD) cells using siRNAs (two-tailed Student t-test, *P < 0.05; **P < 0.01; ***P < 0.001) (n = 4). All data are represented as mean ± SEM. b PCA plots of the transcriptome profiles of Control (Black), FoxK1 KD (Red), FoxK2 KD (Blue), and DKD (Green) cells. c Heatmap of top 50 most significantly changed genes among all groups. d Venn diagram showing the numbers of significantly regulated genes by insulin in Control and DKD cells (FDR < 0.25). e Volcano plot showing the distribution of differentially regulated genes by insulin stimulation with log-fold change in Control versus DKD fold change on X-axis and −log10 P value on Y-axis. f Top directionally regulated reactome pathways by insulin in Control but not DKD cells. g Heatmap of top 50 (up and down: each top 25 for each) differentially regulated by insulin in Control and DKD cells

