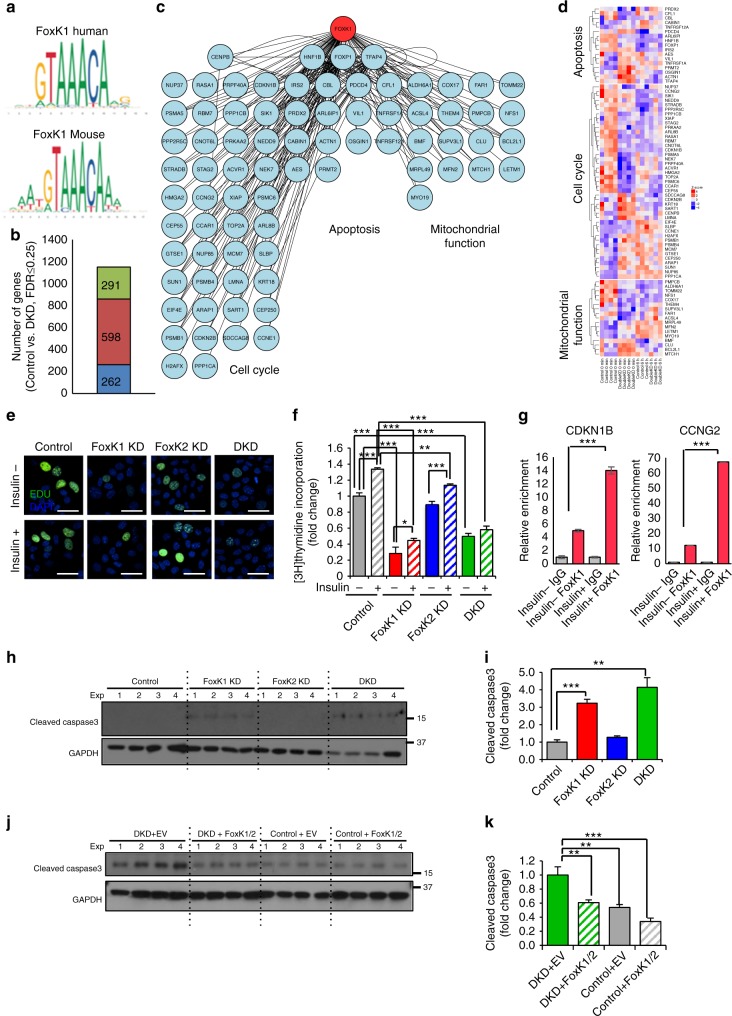
Fig. 7.
Increased apoptosis and reduced proliferation in FoxK1/K2 KD cells. a The promoter consensus sequences for FoxK1 in mice or humans based on Bowman, C. J. et al.23. b The bar graph shows the number of genes (262) carrying the consensus FoxK1/K2 motifs in the promoter regions among 1,151 genes that were differentially regulated in the DKD cells after insulin stimulation compared with those of the Control. c, d The network profile and the heatmap showed three groups of genes with the FoxK1/K2 motifs in the promoter regions as involved in the cell cycle, apoptosis and mitochondria-related genes that were highly affected after insulin stimulation in the Control and DKD cells. e Representative images of EdU (green) incorporation in Control. Foxk1 KD, Foxk2 KD and DKD AML12 cells incubated with 100 µM insulin or vehicle for 24 h. EdU is stained green, and nuclei are stained blue (DAPI). Scale bars, 50 μm. f [3H]-thymidine incorporation in Control, FoxK1 KD, FoxK2 KD and DKD AML12 cells with or without insulin stimulation for 24 h. (One-way ANOVA followed by Tukey-Kramer post hoc analysis, *P < 0.05; **P < 0.01; ***P < 0.001, n = 4). g qChip of FoxK1 at the promoter regions of indicated genes in AML12 cells before and 30 min after 100 nM insulin treatment. (One-way ANOVA followed by Dunnett’s post hoc analysis, *P < 0.05; **P < 0.01; ***P < 0.001, n = 4). h Immunoblotting for cleaved caspase3 in lysates from cells after 24 h serum starvation. i Densitometric analysis of cleaved caspase3 in all groups. (One-way ANOVA followed by t-test with Bonferroni correction, *p < 0.05; **,p < 0.01; ***p < 0.001, n = 4). j Immunoblotting for cleaved caspase3 in lysates from Control (NS siRNA), DKD, Control + Flag-FoxK1/K2 and DKD + Flag-tagged FoxK1/K2 after serum starvation 24 h. k Densitometric analysis of cleaved caspase3 in the groups shown in panel i. (One-way ANOVA followed by t-test with Bonferroni correction, *P < 0.05; **P < 0.01; ***P < 0.001, n = 4). All data are represented as mean ± SEM

