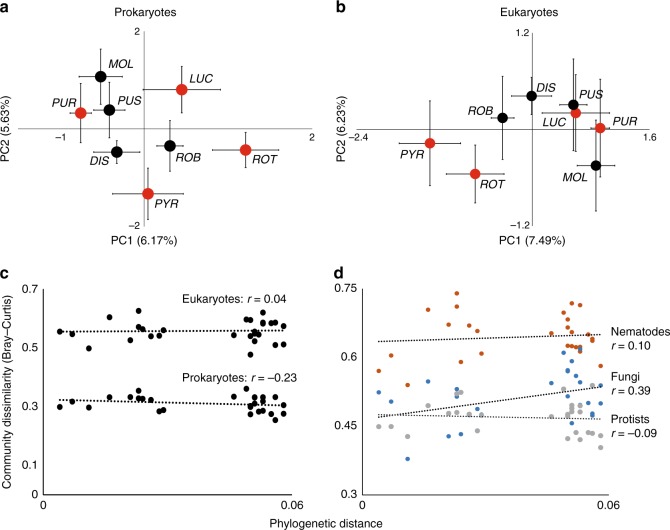
Fig. 1.
Community composition of prokaryotes and eukaryotes. Compositional variation in rhizosphere communities of a prokaryotes (16S rRNA gene reads) and b eukaryotes (18S rRNA gene reads) among native (black dots: G. dissectum (DIS), G. molle (MOL), G. pusillum (PUS), and G. robertianum (ROB)), and range-expanding plant species (red dots: G. lucidum (LUC), G. pyrenaicum (PYR), G. purpureum (PUR), and G. rotundifolium (ROT)), based on five independent replicate soils. Error bars represent SEs of PCA coordinates. Correlations of pairwise phylogenetic distance with community dissimilarity of prokaryotes and eukaryotes (c), and eukaryotic groups nematodes (orange), fungi (blue), and protists (gray) (d). The Pearson’s coefficient r for each correlation is shown

