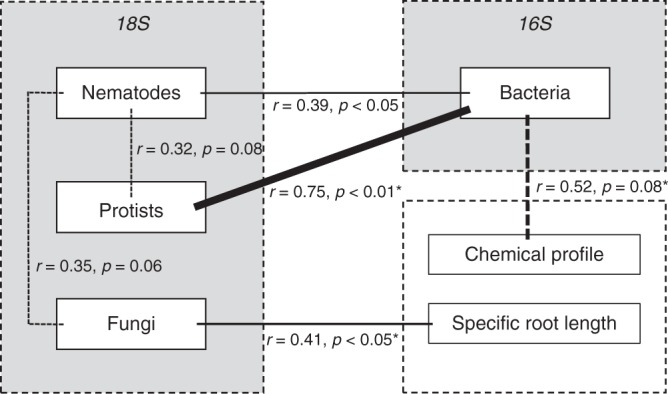
Fig. 2.

Correlational links in the rhizosphere. Overview of correlational links (all correlations with p < 0.1 are shown) between rhizosphere community dissimilarities of bacteria, nematodes, protists, and fungi (all based on OTUs; 4–5 replicates per species) and between root trait variation (root chemical profile (4 replicates per species), specific root length (3 replicates per species)), and dissimilarities of rhizosphere communities. Significant correlations (based on Mantel tests) are depicted with solid lines, whereas trends (p > 0.05, < 0.10) are depicted with dashed lines. Line thickness represents the relative strength of the correlational link based on r-values. Links that are significant based on a structural equation model (Supplementary Fig. 7) are represented with asterisks (*). Source data are provided as a Source Data file
