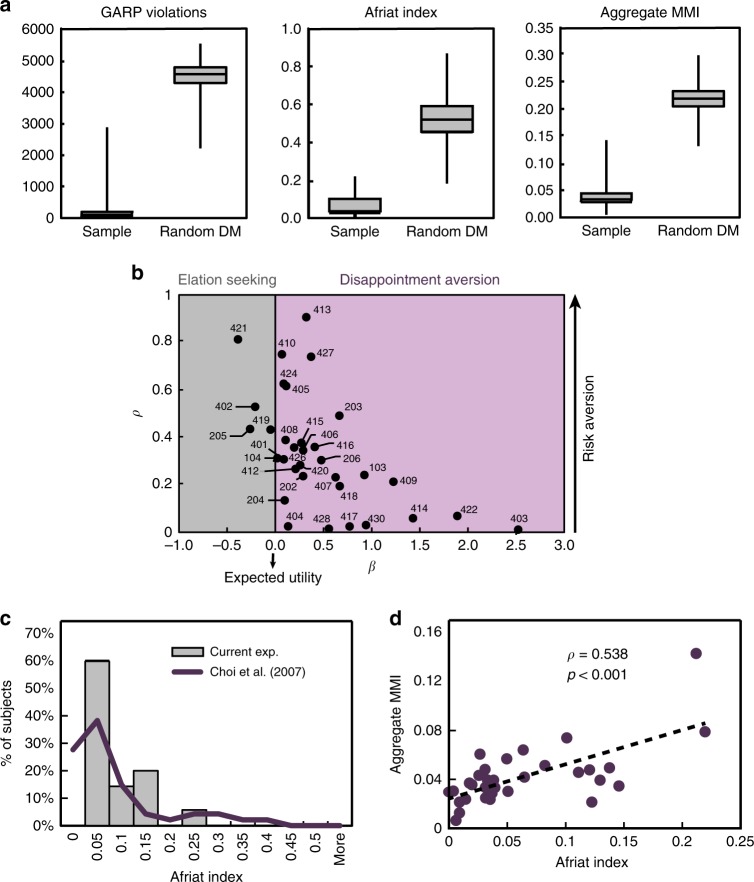
Fig. 3.
Behavioral results. a Actual subjects vs. random subjects: In our sample, the median number of GARP violations was 59 (std = 506.24, min = 1, lower quartile = 11, upper quartile = 166, max = 2873), the median Afriat index was 0.0362 (std = 0.058, min = 0.0007, lower quartile = 0.0258, upper quartile = 0.1011, max = 0.2197), and median Aggregate MMI score was 0.037 (std = 0.0242, min = 0.0065, lower quartile = 0.0297, upper quartile = 0.0481, max = 0.143). Both the aggregate MMI and Afriat index range between 0 (fully consistent) and 1. For comparison, 25,000 simulations of random decision-makers yielded median number of GARP violations of 4,568.5 (std 397.6, min = 2216, lower quartile = 4294, upper quartile = 4794, max = 5565), a median Afriat Index of 0.5229 (min = 0.182, lower quartile = 0.4545 upper quartile = 0.5905, max = 0.872) and a median Aggregate MMI of 0.2186 (min = 0.1332, lower quartile = 0.2047, upper quartile = 0.2326, max = 0.299). These high scores indicate that our subjects did not choose randomly along the budget lines. b Recovered parameters using the MMI with the Disappointment Aversion (DA) utility function with Constant Relative Risk Aversion (CRRA) functional form69 (see Methods). The β and ρ parameter estimates for each subject are plotted. When β < 0 (“elation seeking”, four subjects, gray area), the subject overweights the higher prize. When β < 0 (“disappointment aversion”, 29 subjects, purple area), the subject overweights the lower prize. Higher ρ values represent higher risk aversion levels. When β < 0, it is the case of the common Expected Utility (if, in addition, ρ = 0, it is the special case of Expected Value). c Comparison with lab experiments: Distributions of Afriat index of our subjects compared with Choi et al.13. d Validity of MMI. Correlation of Afriat index with Aggregate MMI (ρ = 0.538, p < 0.001, n = 33)

