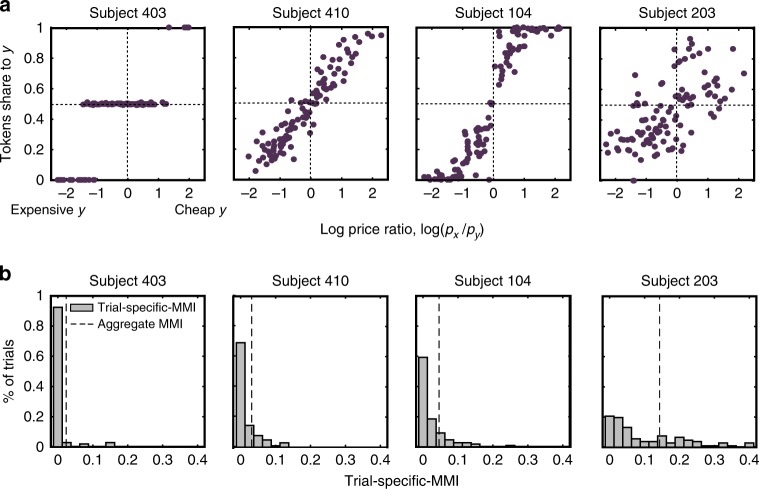
Fig. 4.
Representative subjects. a Scatterplots of prominent behaviors: The y-axis represents the share of tokens allocated to the Y account as a function of the log price ratio, log(px / y) (x-axis). As the log price ratio increases, account Y becomes relatively cheaper. Subject 410 equalized expenditures between the two accounts, as she divided tokens proportionally to the price ratio (Cobb–Douglas preferences). Subject 104 exhibited similar behavior, but chose to allocate the entire endowment to the cheaper account in extreme slopes. Subject 403 chose the safe bundle, when the prices of X and Y were relatively similar and allocated most or all her tokens to the cheaper account when the price ratio between the accounts was relatively high (steeper slopes). Even a highly inconsistent subject, like subject 203, was sensitive to changes in prices, with the share of tokens to the Y-account declining as its price rises. b Variability of trial-specific MMI: Distributions of the trial-specific MMI for the four representative subjects from panel a showcase the heterogeneity of trial-specific MMI scores across and within subjects. For example, subject 203 was highly inconsistent throughout most of her trials, while subject 403 was mostly consistent

