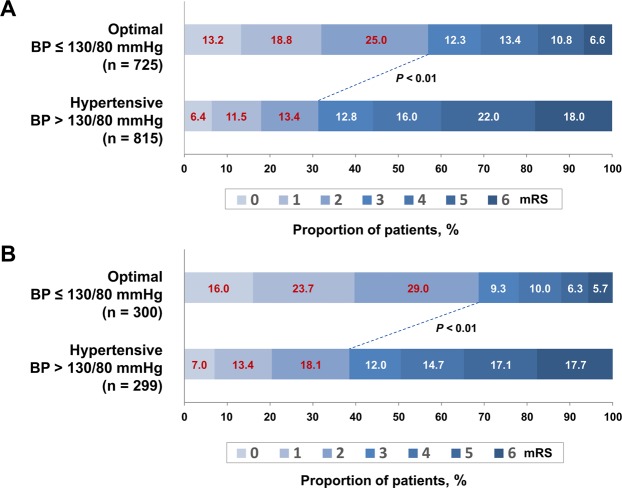
Figure 1.
Primary outcome according to blood pressure (BP). Distribution of the modified Rankin Scale (mRS) scores among all patients (A) and in patients with recanalization (B) classified according to BP at 3 months after ischemic stroke. The lines indicate differences in mRS categories (mRS scores 0–2 vs. 3–6) between groups according to BP. The p-value refers to the significance level of the chi-square test used to analyze the proportions of mRS scores.

