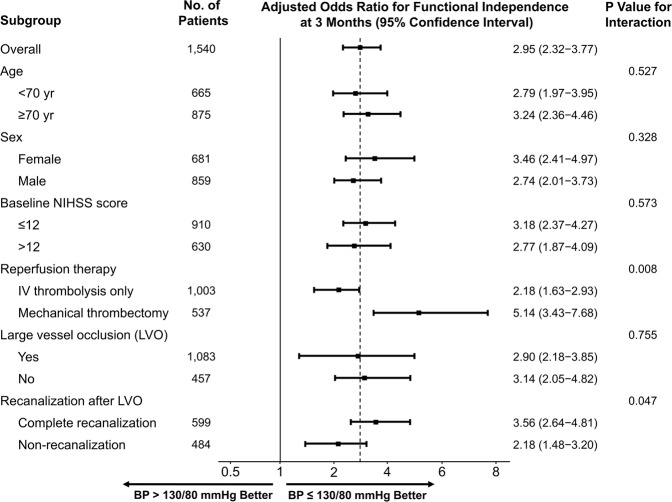
Figure 2.
Subgroup analyses of the primary outcome. The forest plot shows that the difference in the odds ratio for functional independence (defined as a modified Rankin Scale score of 0–2) at 3 months favored the blood pressure ≤ 130/80 mmHg group across all prespecified subgroups. NIHSS, National Institutes of Health Stroke Scale; IV, intravenous. Adjusted variables: age, sex, diabetes mellitus, dyslipidemia, atrial fibrillation, smoking, NIHSS score at 24 h, recanalization, and mechanical thrombectomy.

