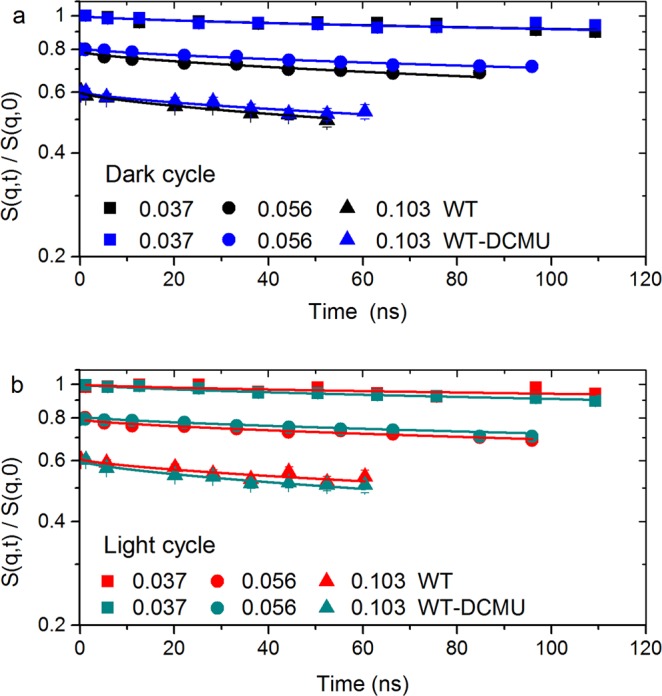
Figure 1.

S(q, t)/S(q, 0) of native and inhibited cyanobacterial cells. All scattering functions start at unity and are shifted for better visualization. Solid lines represent fitting by a stretched exponential model10,11 according to Eq. (1); Only one q value per time-of-flight grouping for each sample is shown here (note: the full set of data is available). Panel “a” displays the evolution of membranes in dark and Panel “b” shows the evolution of membranes in light conditions. Error bars represent statistical error (1σ), in some cases smaller than the size of the symbol used.
