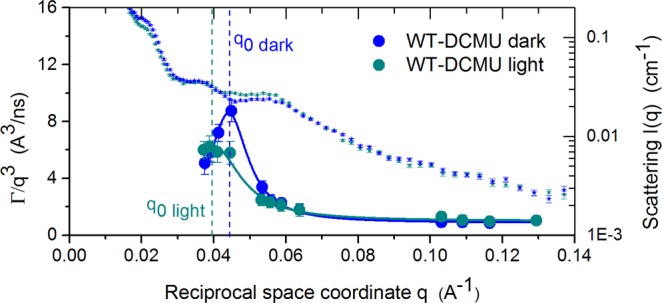
Figure 4.

q-dependence of the q3-normalized decay rate Γ/q3 for DCMU inhibited cyanobacterial cells. A plot of membrane relaxation rate during dark and light conditions is superimposed by Small Angle Scattering data (small symbols). Solid lines in same color are the Lorentz fit according to Eq. (2). Peak position, q0, is marked, corresponding to length scale of probed local shape fluctuations. Error bars represent statistical error (1σ), in some cases smaller than the size of the symbol used.
