Figure 3.

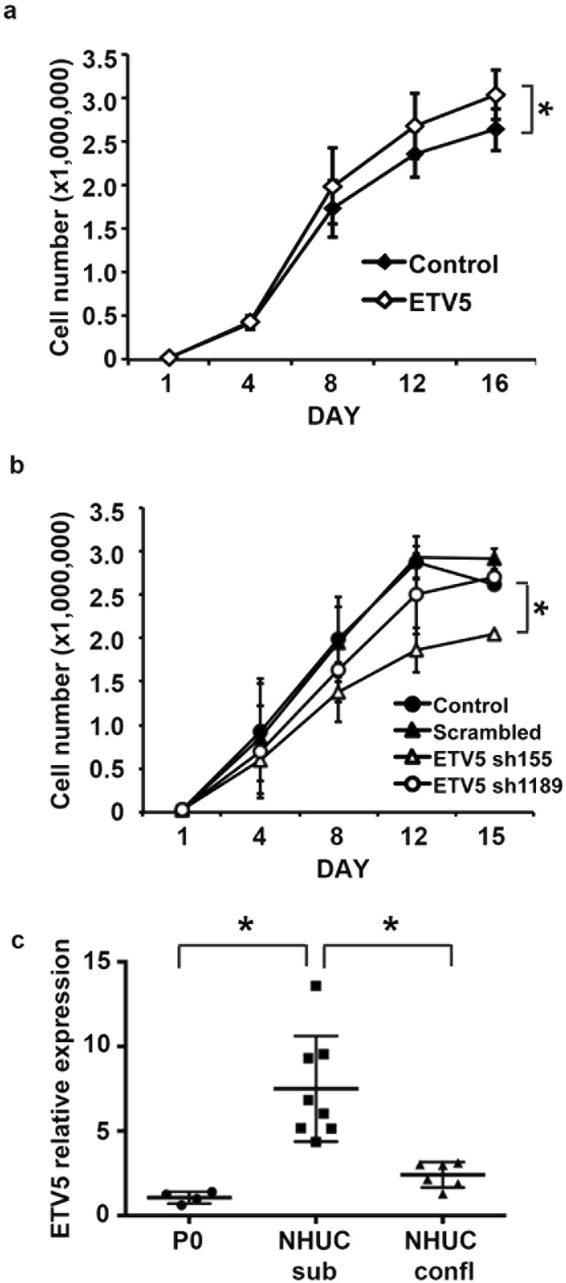
ETV5 expression and cell density of normal urothelial cells are mutually dependent. (a) Growth curves of TERT-NHUC overexpressing ETV5 and control cells transduced with the empty vector; (b) Growth curves of TERT-NHUC with knockdown of ETV5 (sh155 and sh1189), and control cells transduced with the empty vector (Control) or a scrambled shRNA; (c) mRNA relative expression of ETV5 in uncultured NHUC (passage zero, P0), and cultured mortal NHUC in sub-confluent (NHUC sub) and confluent conditions (NHUC confl). ETV5 mRNA expression levels were relatively quantified using Taqman Real-Time RT-PCR with SDHA as internal control. All experiments were repeated in triplicate. ‘*’ indicates a statistical significant difference between samples.
