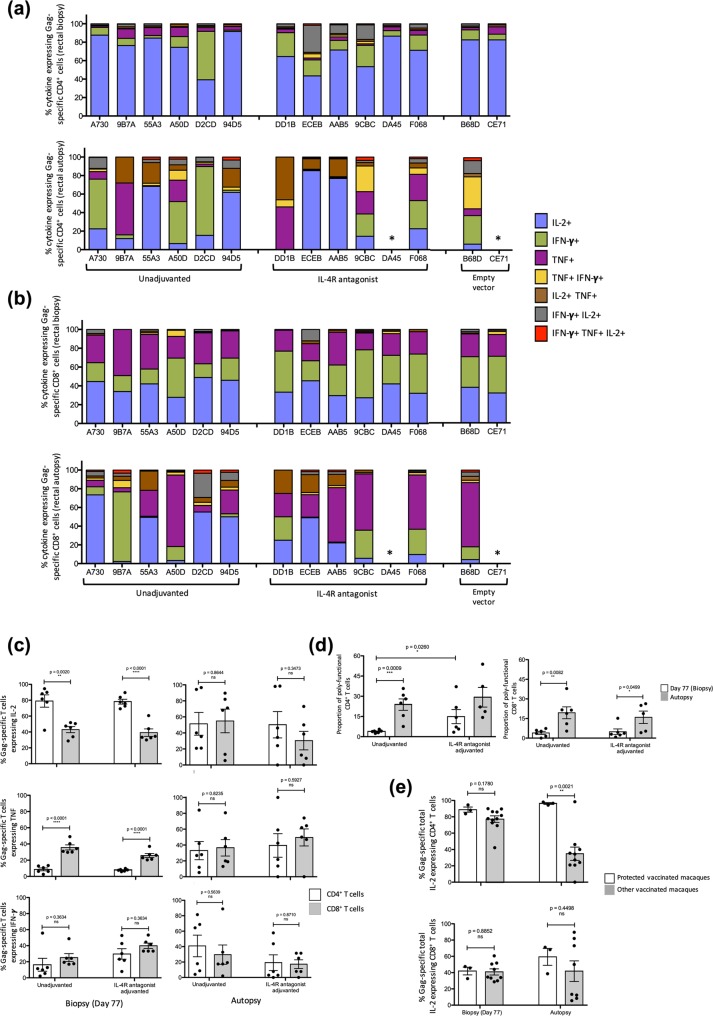
Figure 7.
Evaluation of Gag-specific rectal CD4+ and CD8+ T cells at biopsy and autopsy. Rectal biopsies (day 77) and autopsies were performed and single cell suspensions were prepared from tissue samples, stimulated with 15 mer overlapping SIV Gag-specific peptide pool and their cytokine expression profiles were measured by multi-colour intracellular cytokine staining. Proportion of cytokine expressing (a) CD4+ T cells and (b) CD8+ T cells from biopsy (top panel) and autopsy (bottom panel) expressing the three cytokines of interest, IFN-γ, TNF, IL-2 individually or in a combination are presented as stacked bar charts as in Fig. 6. Rectal sample could not be obtained from DA45 and CE71 at autopsy and are hence labelled as “*”. Please see Supplementary Tables 3, 4 for absolute T cell counts. (c) The total IL-2 (top panel), TNF (middle panel) and IFN-γ (bottom panel) was also measured at both biopsy (left) and autopsy (right) by CD4+ and CD8+ T cells in both unadjuvanted and IL-4R antagonist vaccine groups. (d) The extent of CD4+ T cell (left) and CD8+ T cell (right) poly-functionality was also determined between the two vaccinated groups. (e) IL-2 expression by CD4+ T cells (top panel) and CD8+ T cells (bottom panel) from the three protected animals (AAB5, 55A3 and 94D5) were also compared to the remaining macaques at both biopsy and autopsy. Unpaired student’s t tests were performed to assess statistical significance.

