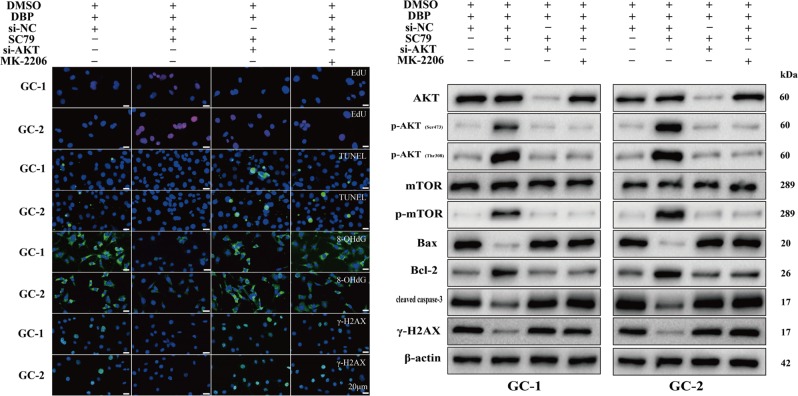
Fig. 3. DBP induces cytotoxicity dependent on inhibiting AKT pathway.
a Representative IF images showing the number of EdU, TUNEL, 8-OHdG, and γ-H2AX positive cells in GC-1 and GC-2 cells after DBP treatment, SC79 treatment, AKT knockdown, or MK-2206 treatment. Scale bar, 20 μm. b Representative WB images showing the protein levels of AKT, p-AKT (Ser473), p-AKT (Thr308), mTOR, p-mTOR, Bax, Bcl-2, cleaved caspase-3, and γ-H2AX in GC-1 and GC-2 cells after DBP treatment, SC79 treatment, AKT knockdown, or MK-2206 treatment. Protein loading is indicated by β-actin. All measurements are shown as the means ± SD from three independent experiments

